01:00
The Data Analysis Pipeline
![]()
a grammar for transforming data frames
library(dplyr) OR library(tidyverse)
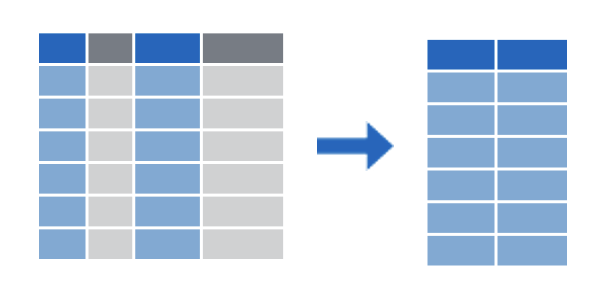
Subsetting Columns vs Rows
select()
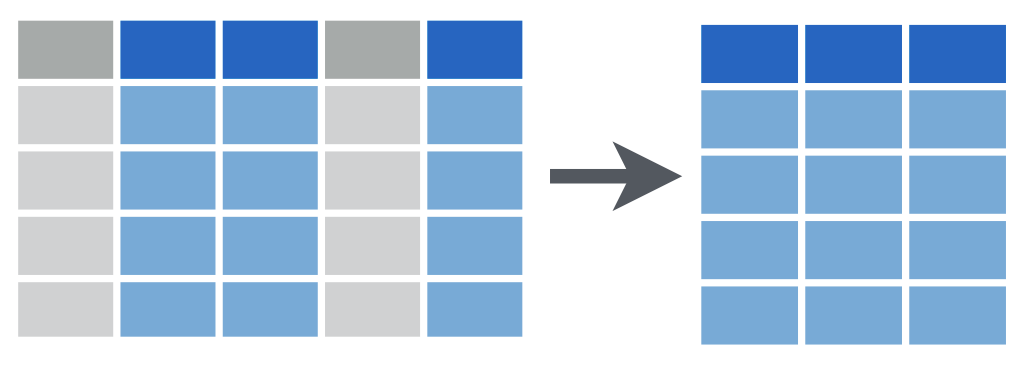
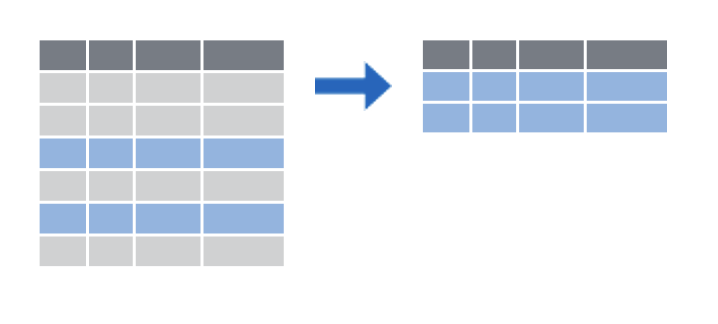
filter()

select()
select(covid_testing, mrn, last_name)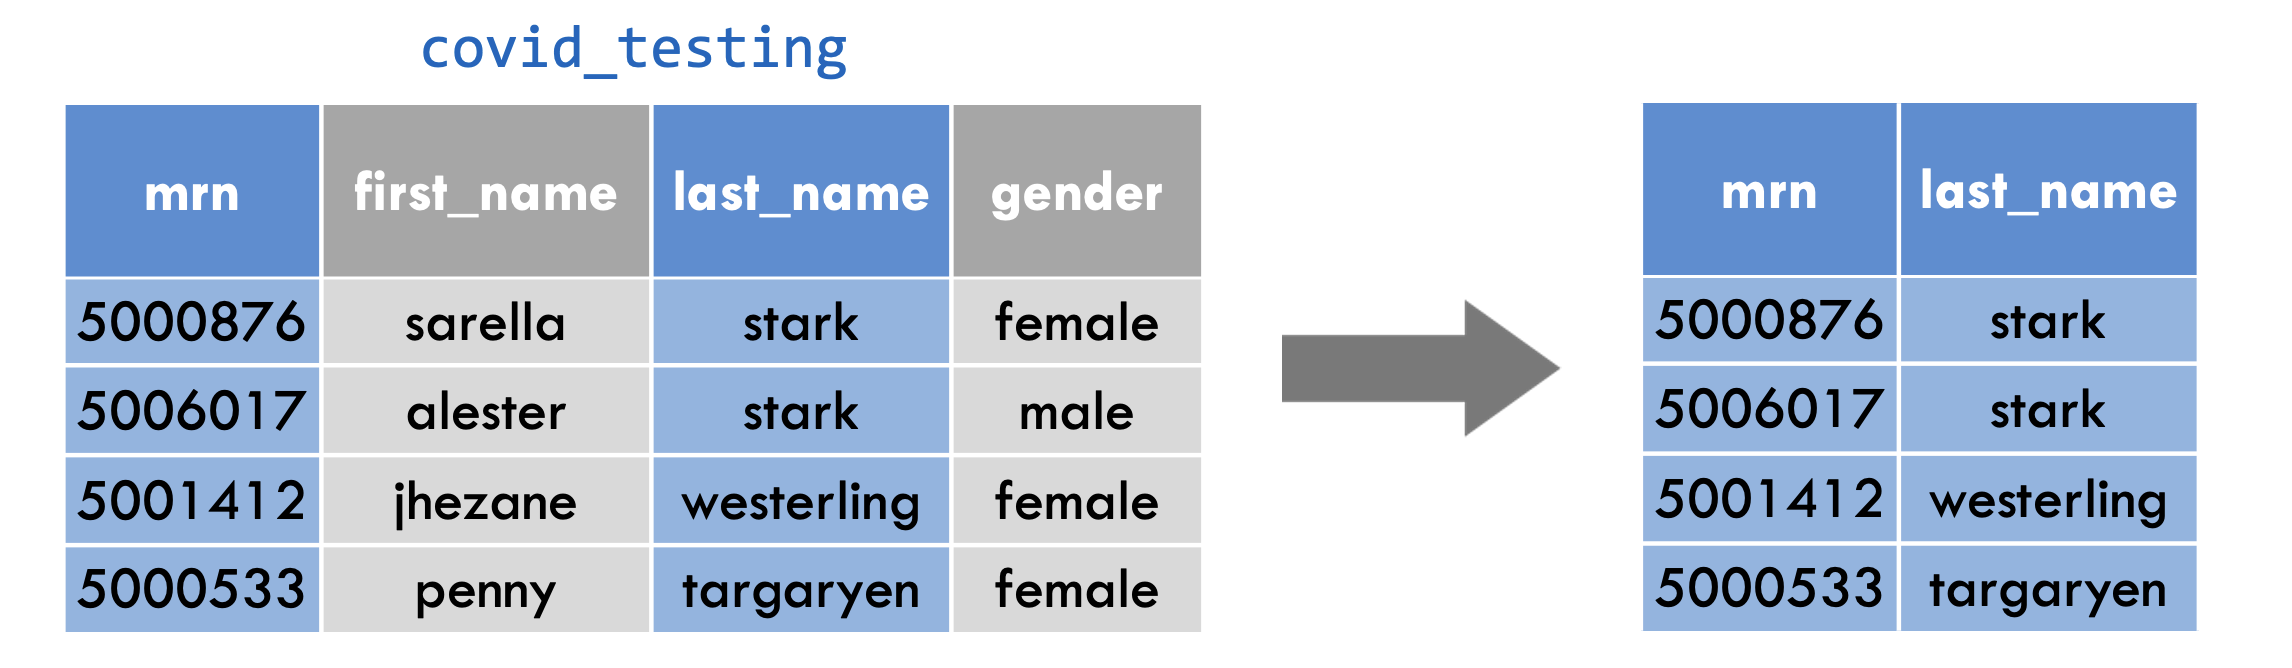
filter()
filter(covid_testing, mrn == 5000083)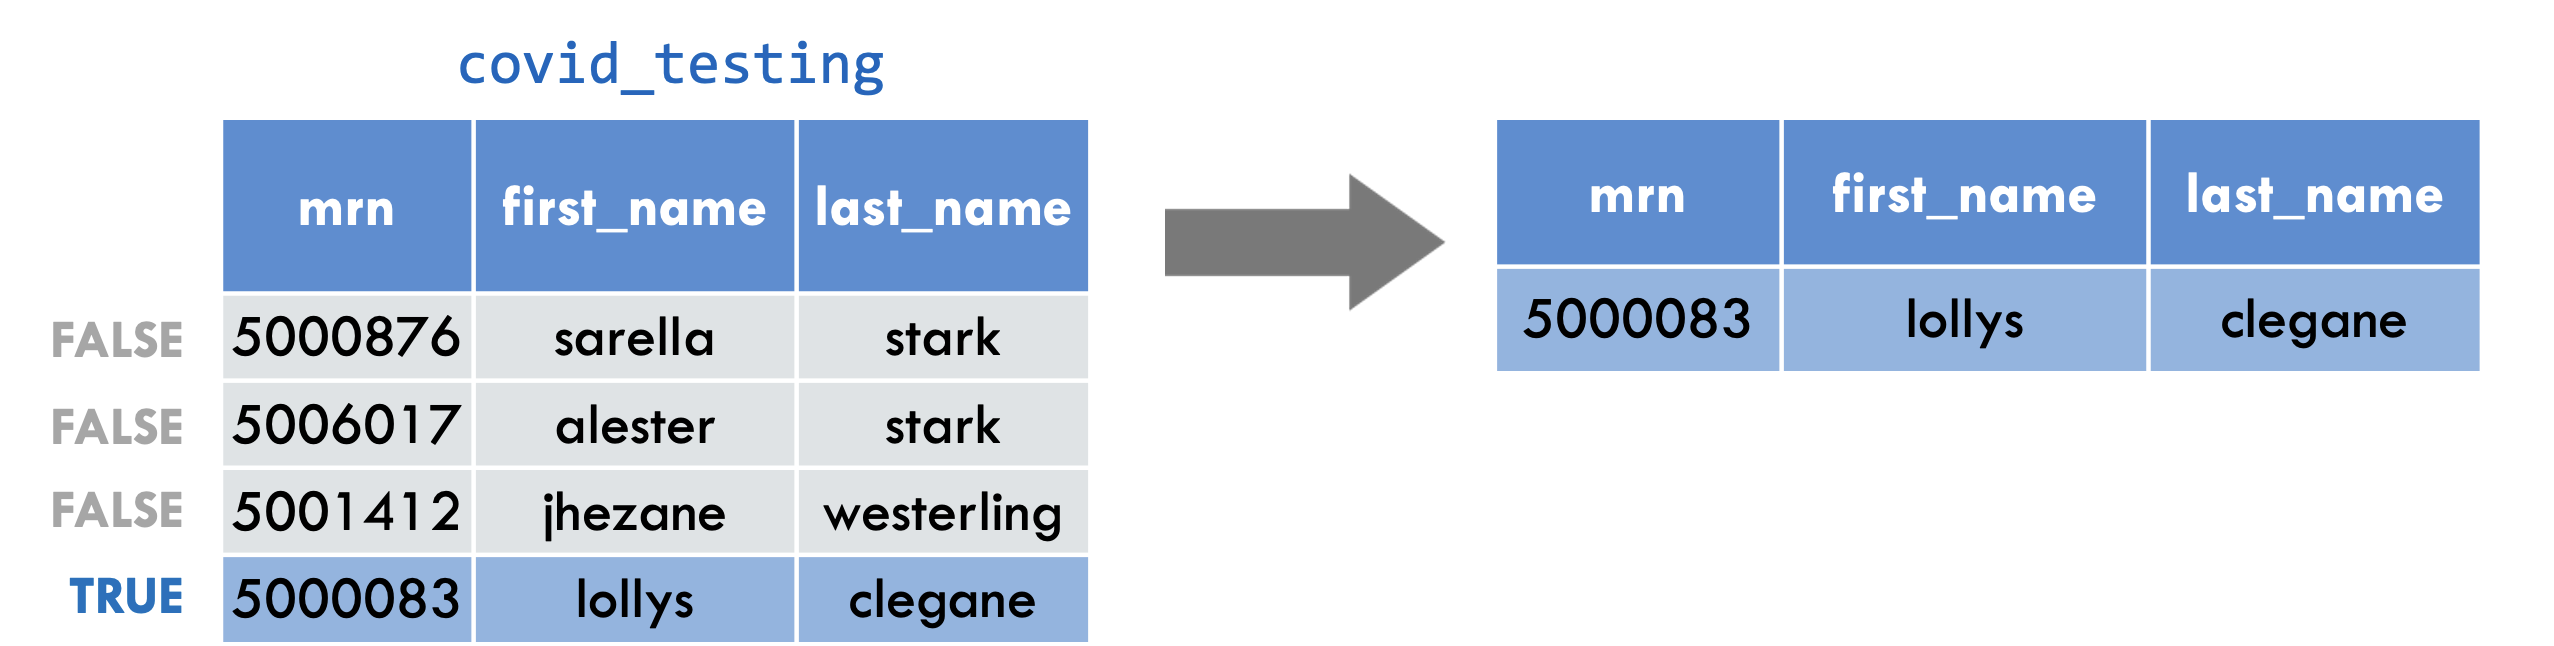
filter(covid_testing, last_name != "stark")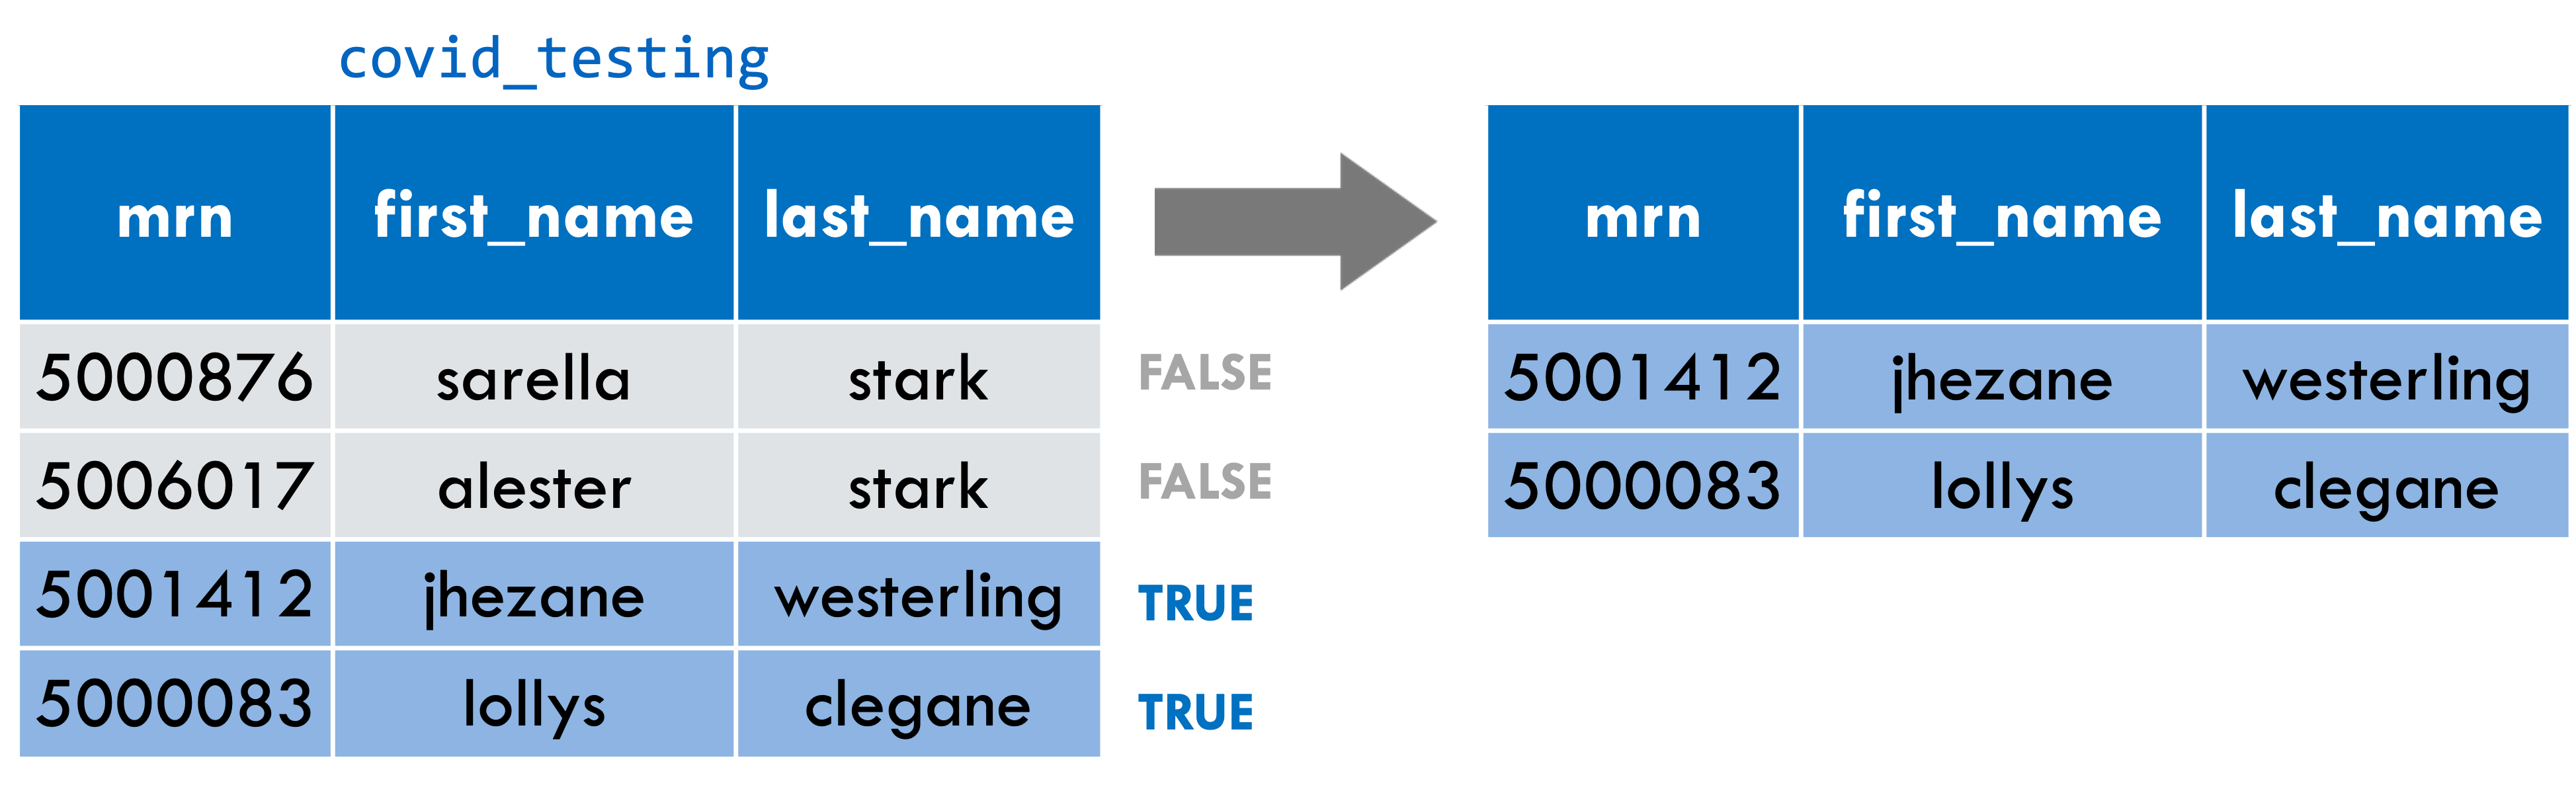
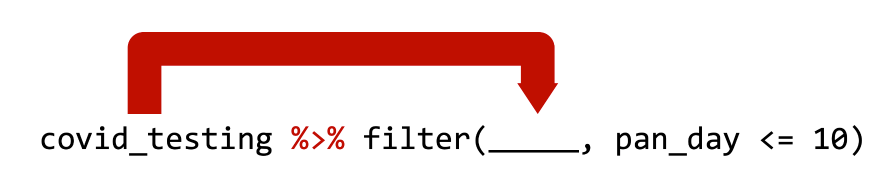
The Pipe Operator
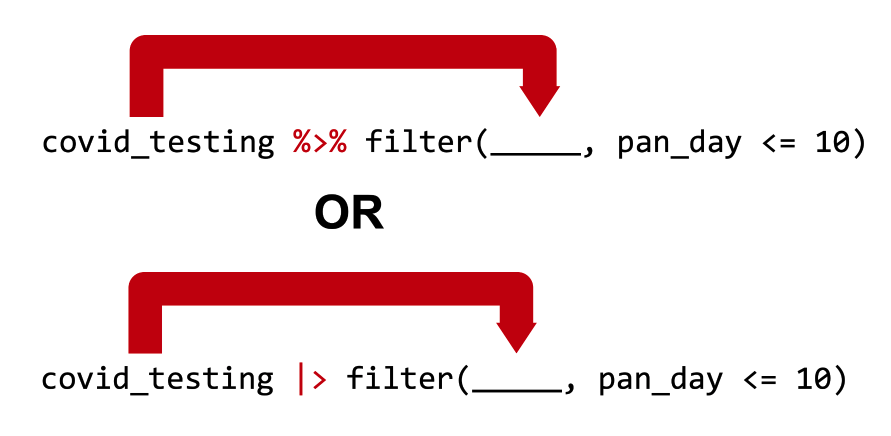
Passes the object on the left as the first argument to the function on the right
covid_testing %>% filter(pan_day <= 10) is equivalent to filter(covid_testing, pan_day <= 10)
OR, if you in the future use the “new” pipe:
covid_testing |> filter(pan_day <= 10) is equivalent to filter(covid_testing, pan_day <= 10)
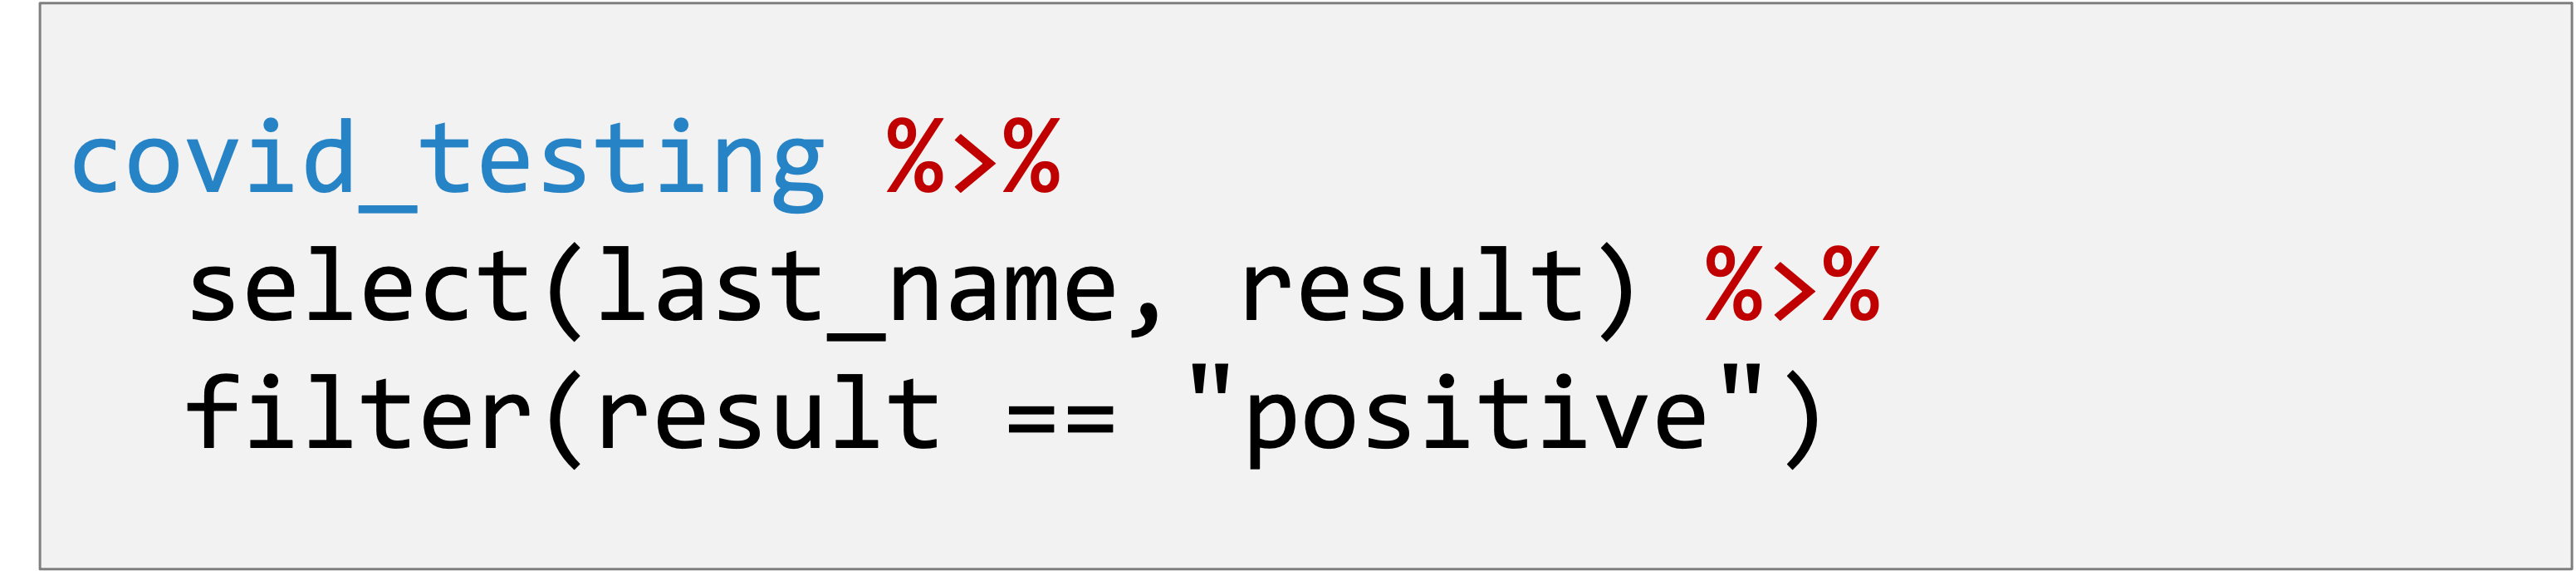
- Start with the
covid_testingdata frame. THEN - Select so that we get only certain columns. THEN
- Filter so that we get only certain rows.
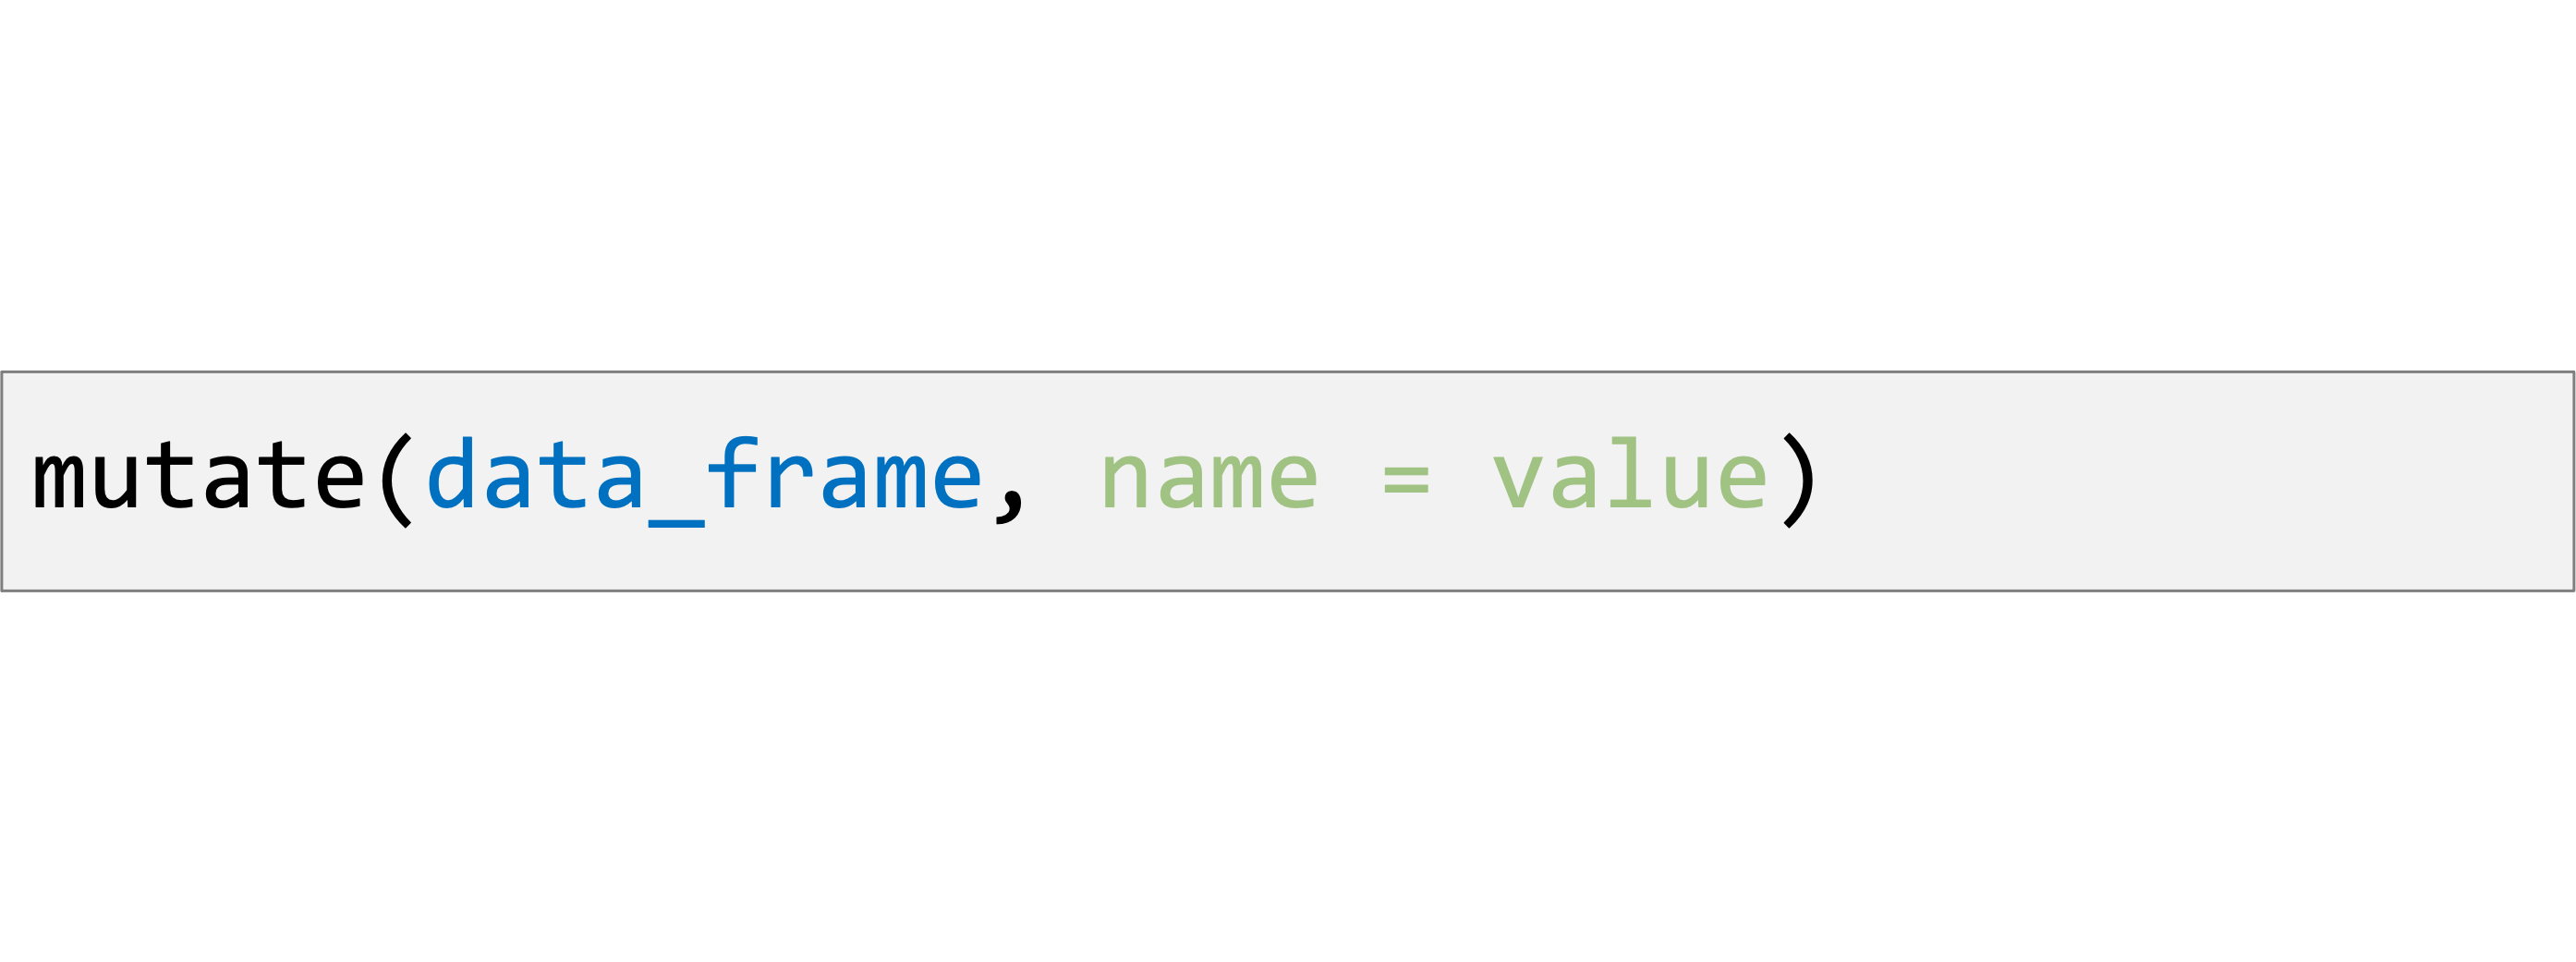
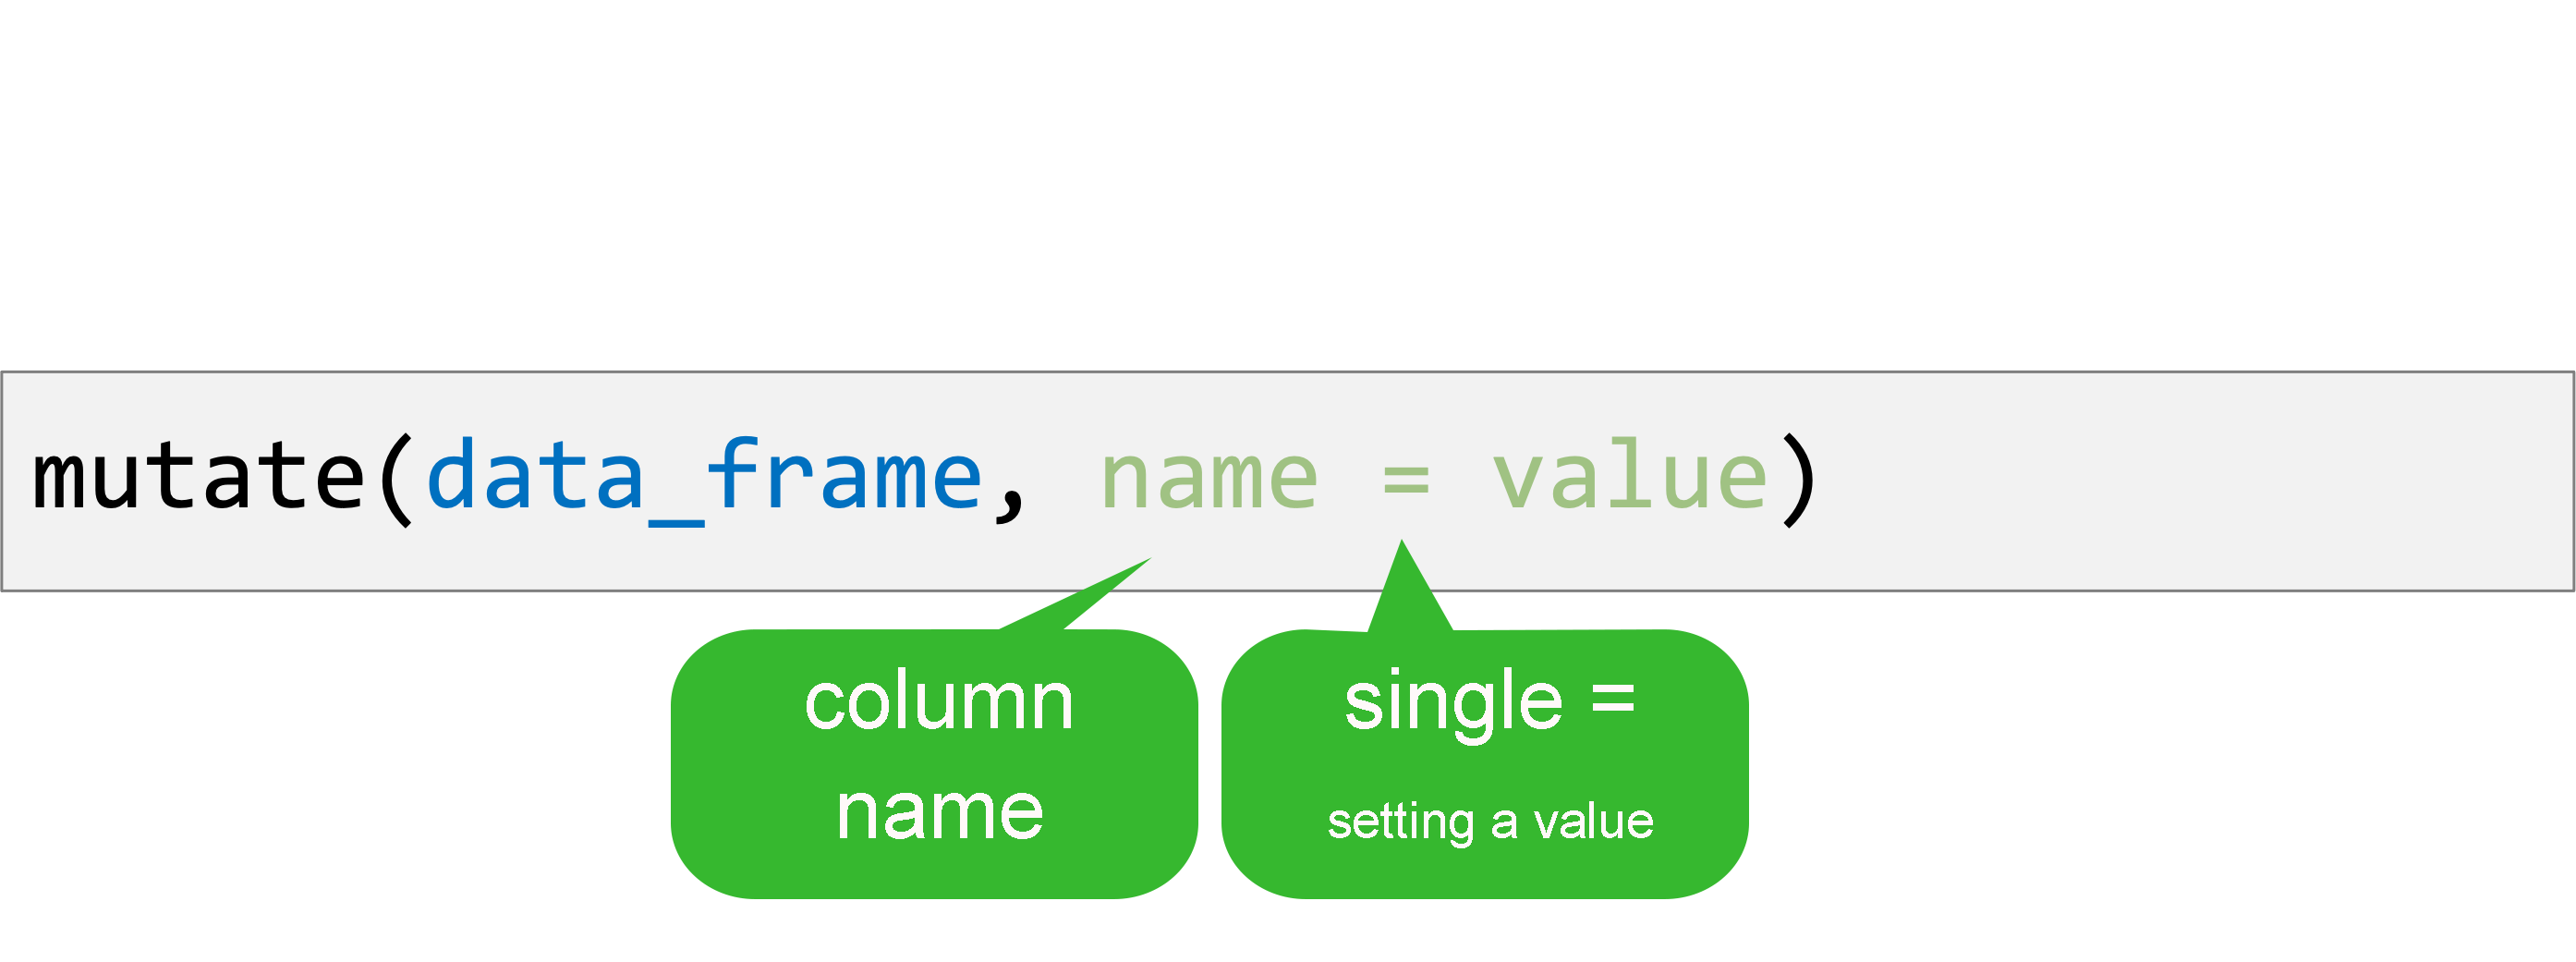
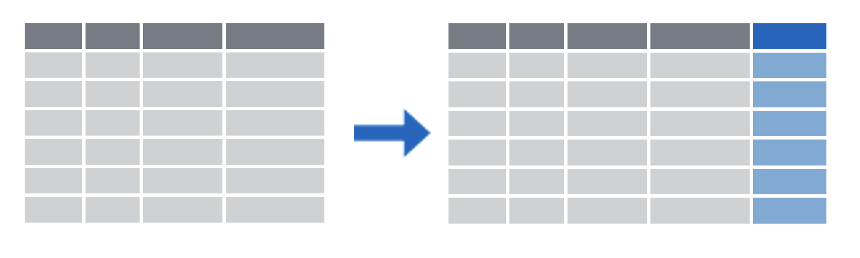
mutate()
Create new or updated, optionally calculated columns.
mutate()
Create new or updated, optionally calculated columns.
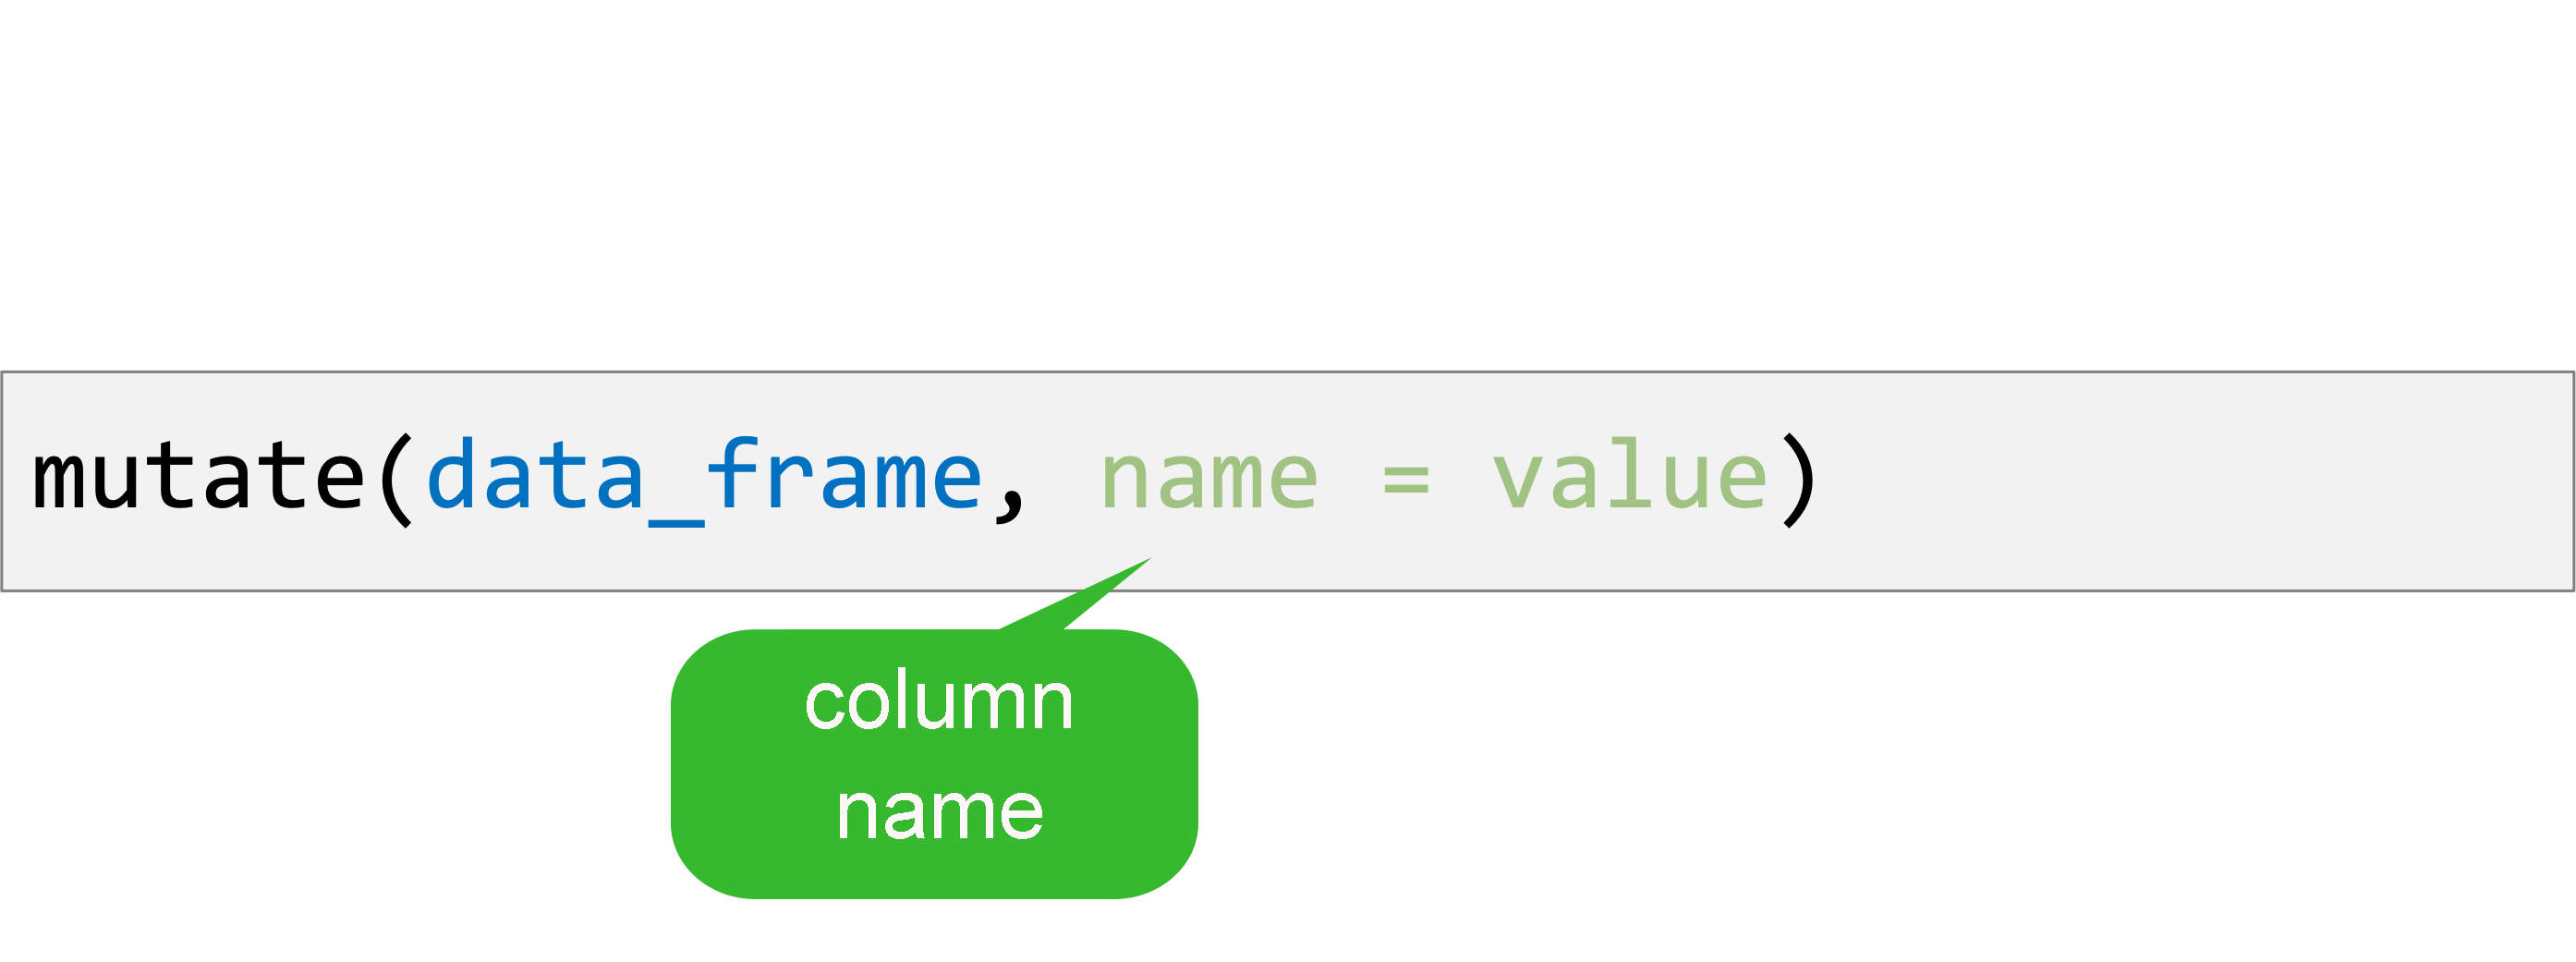
mutate()
Create new or updated, optionally calculated columns.
mutate()
Create new or updated, optionally calculated columns.
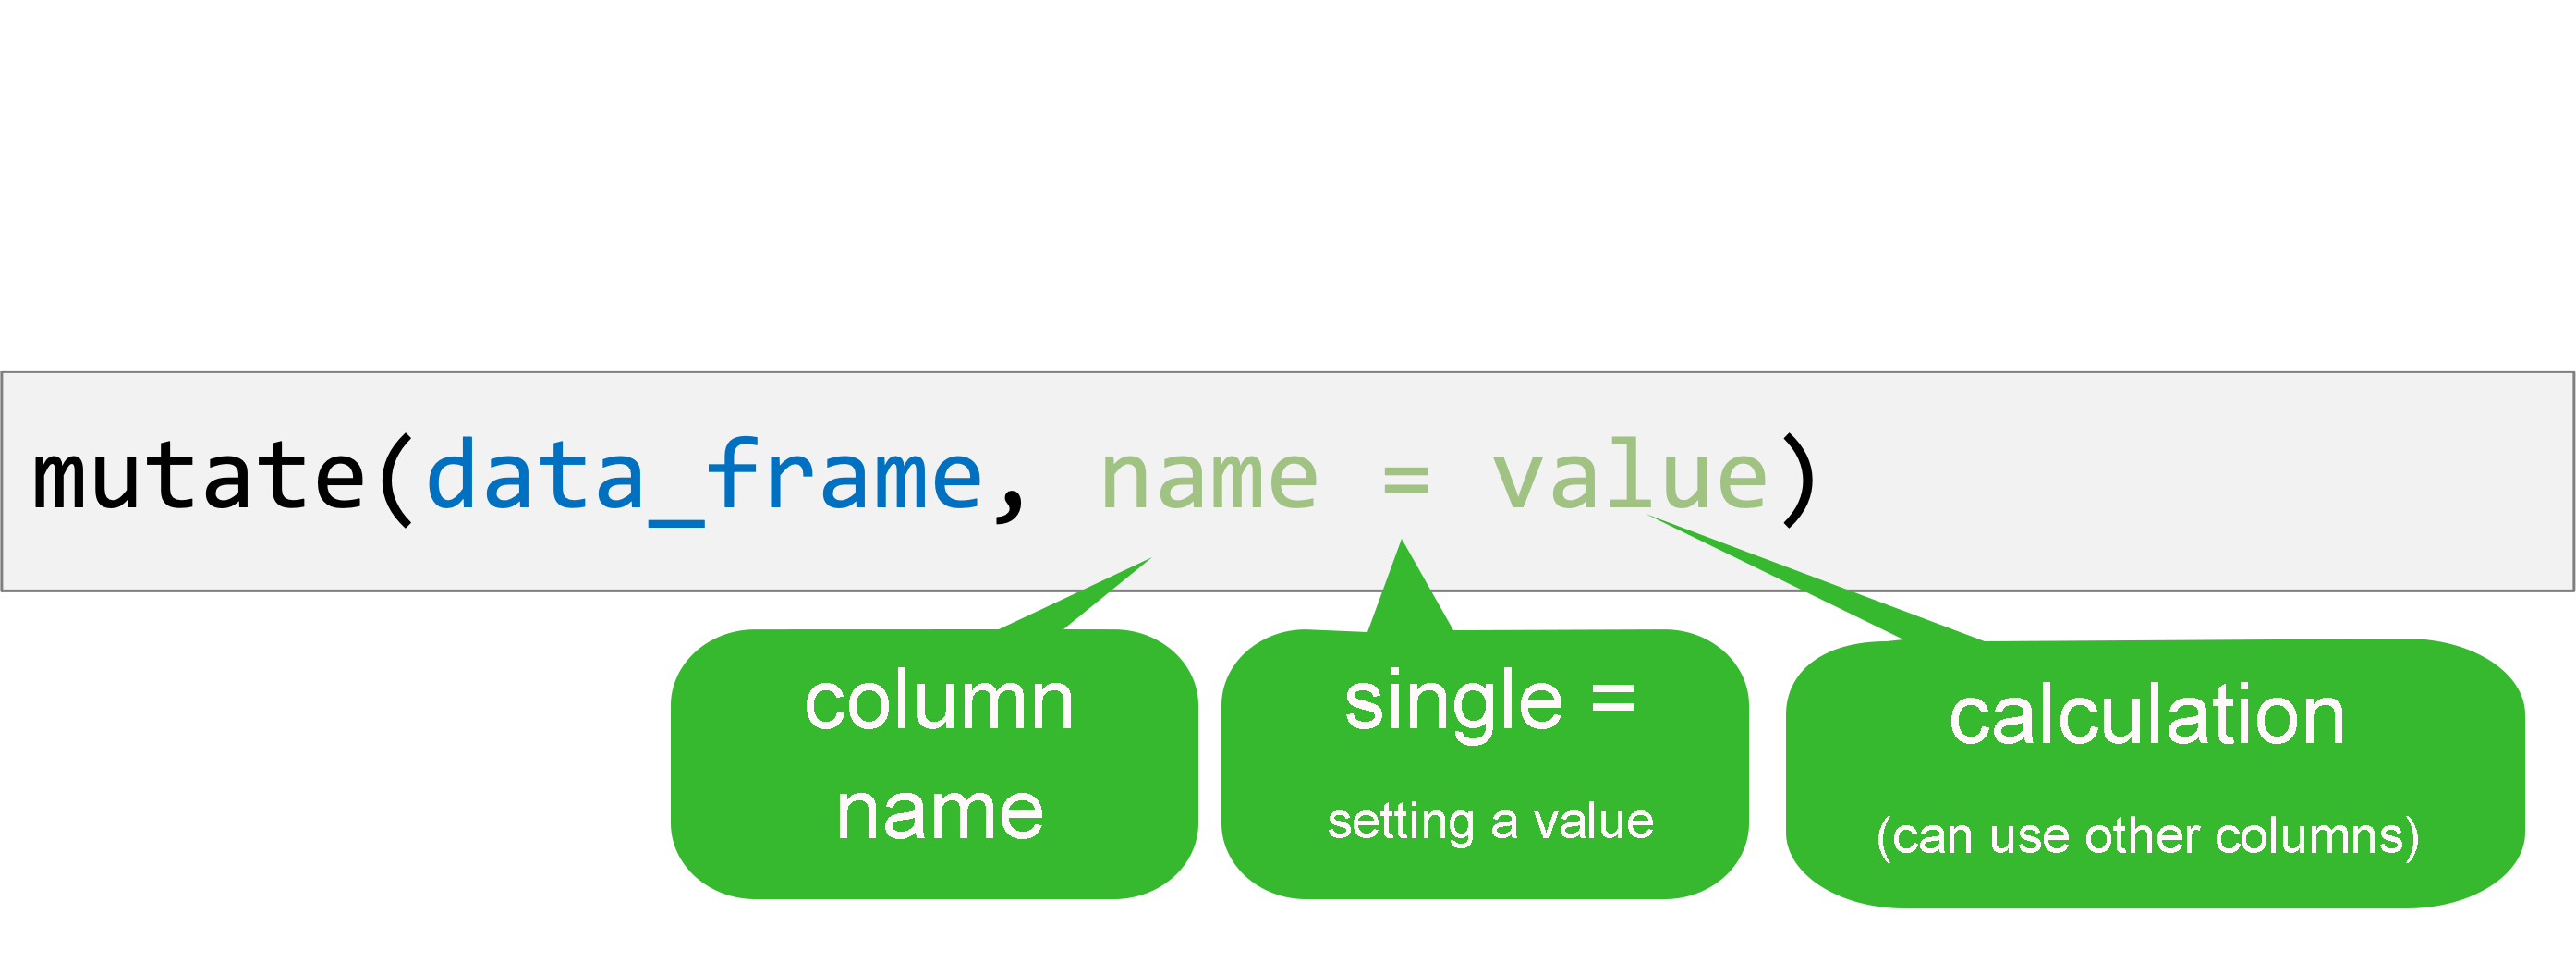
mutate()
mutate(covid_testing,
     col_rec_tat_mins = col_rec_tat * 60)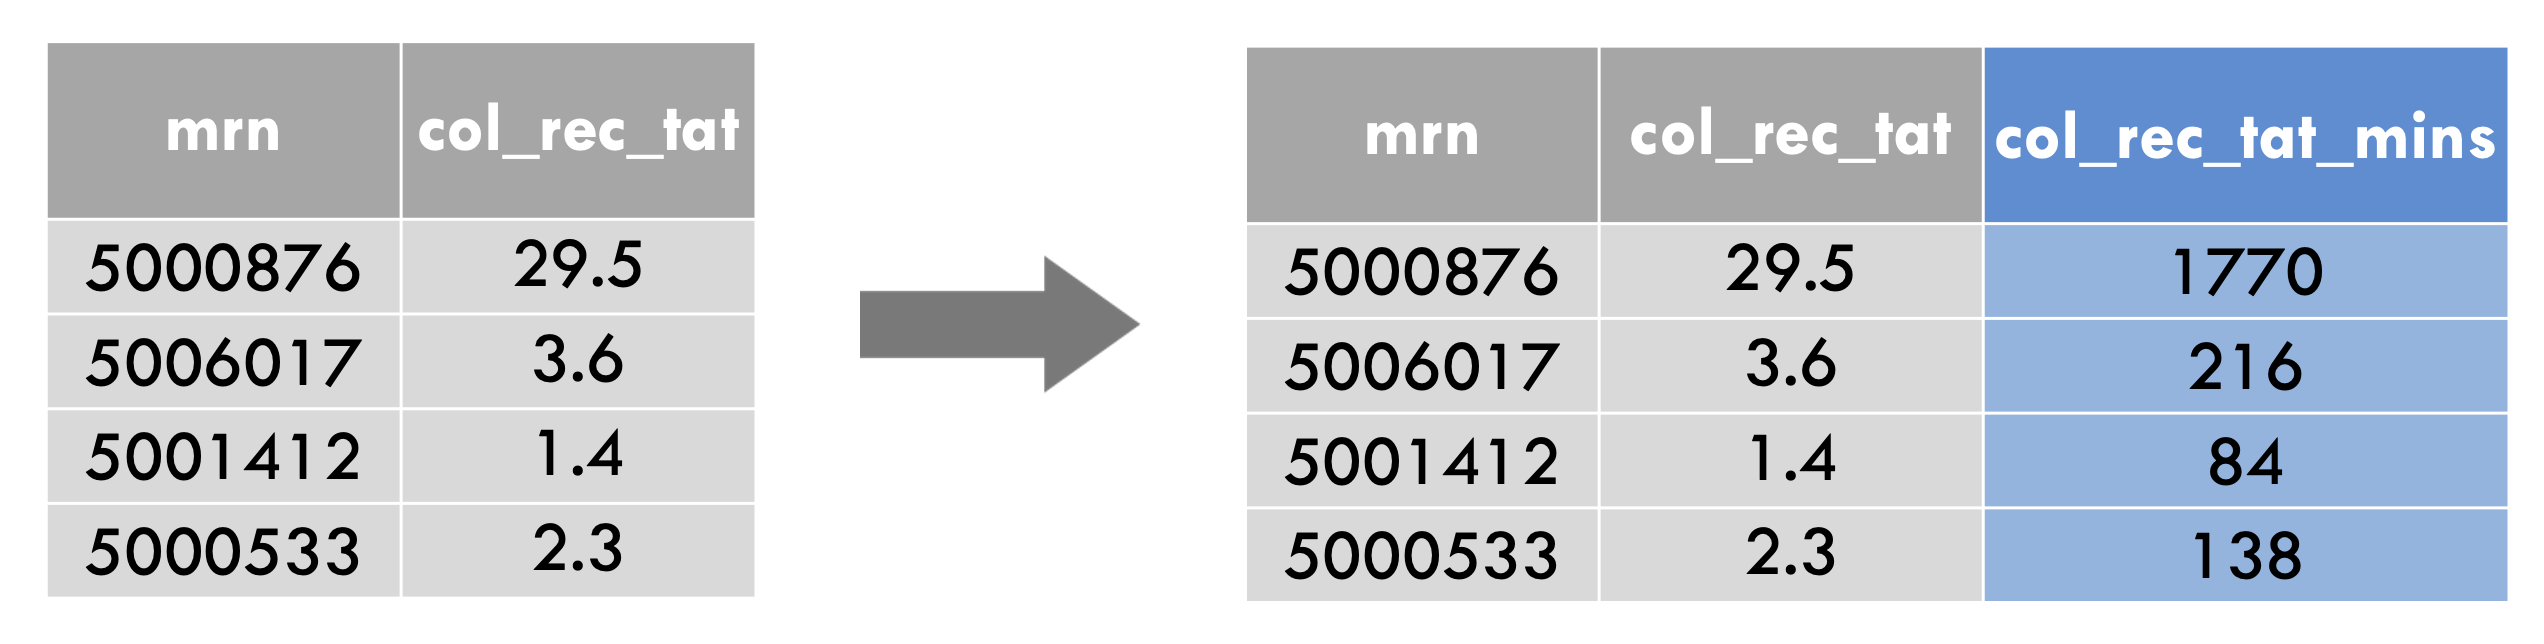
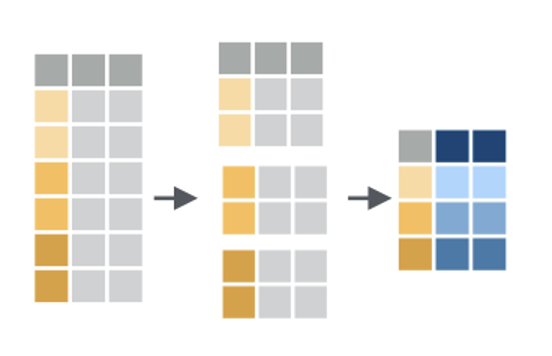
Group By and Summarize
A very common use case is to divide your data into groups, and get information about each group.
For this, we’ll use group_by and summarize.
Recap
select() subsets columns by name
filter() subsets rows by a logical condition
mutate() creates new calculated columns or changes existing columns
Use the pipe operator %>% to combine dplyr functions into a pipeline
group_by() with summarize() gives per-group statistics
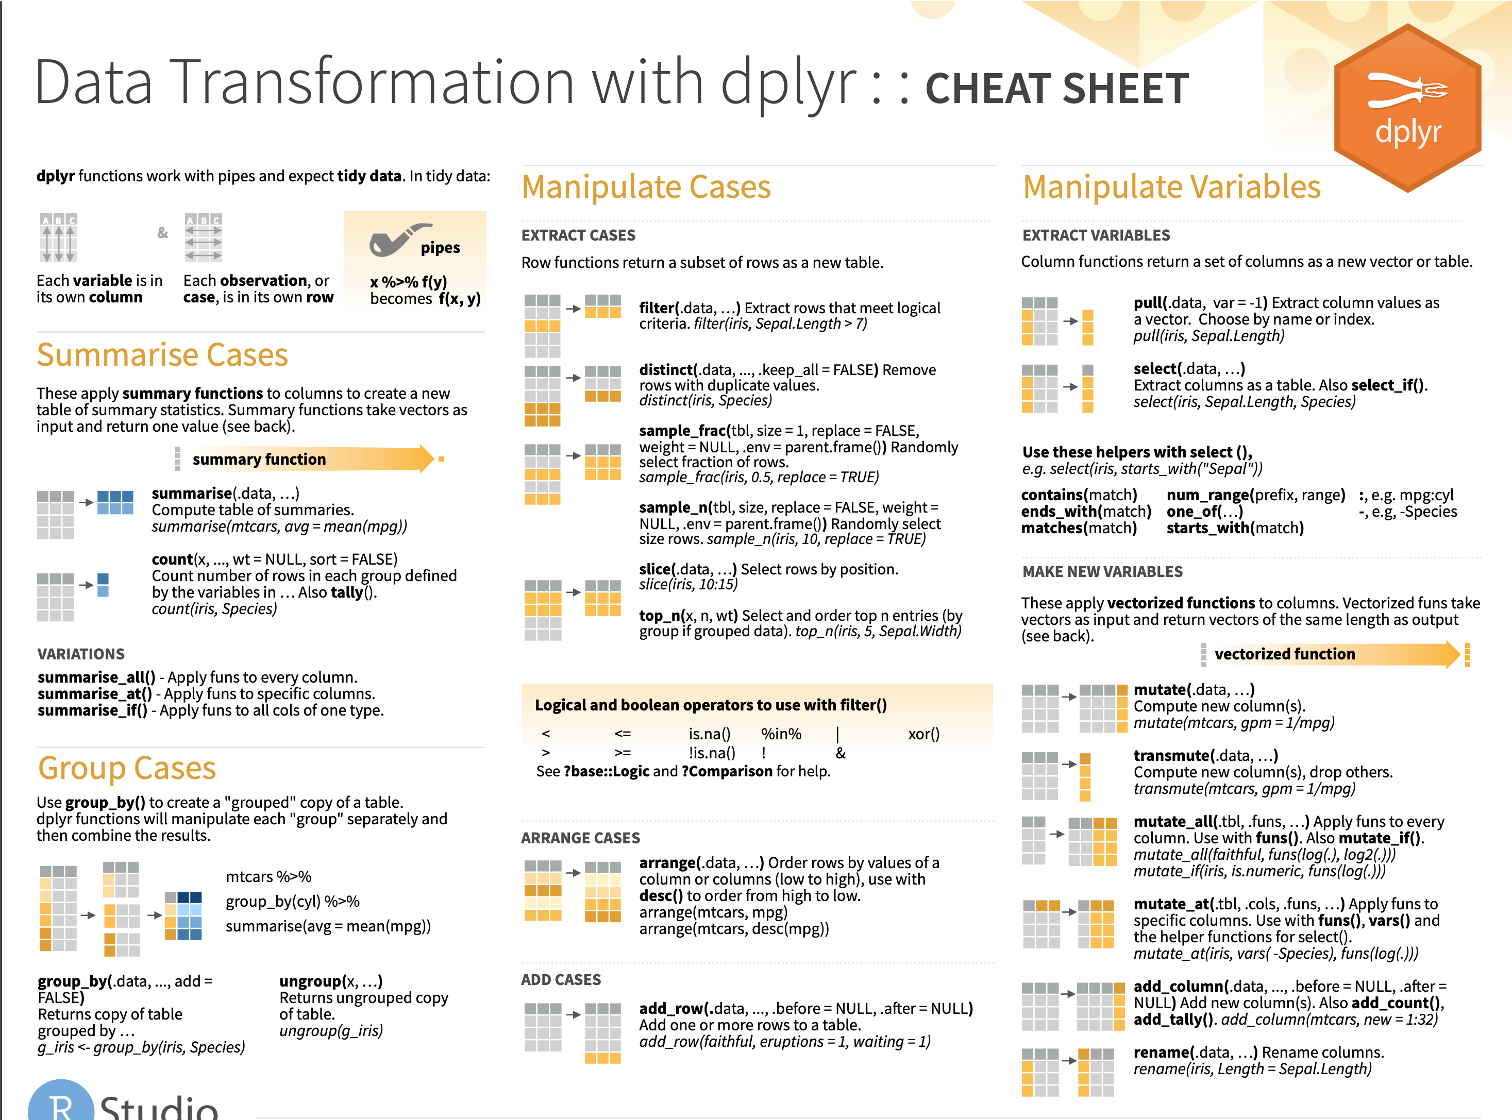
Cheatsheet (more dplyr functions!)

Next Up: Final Notes
If you want to look at Dashboards, a section we have decided to cut for time, you can find that here: Dashboards.
But we’ll be moving on to Final Notes.