01:00
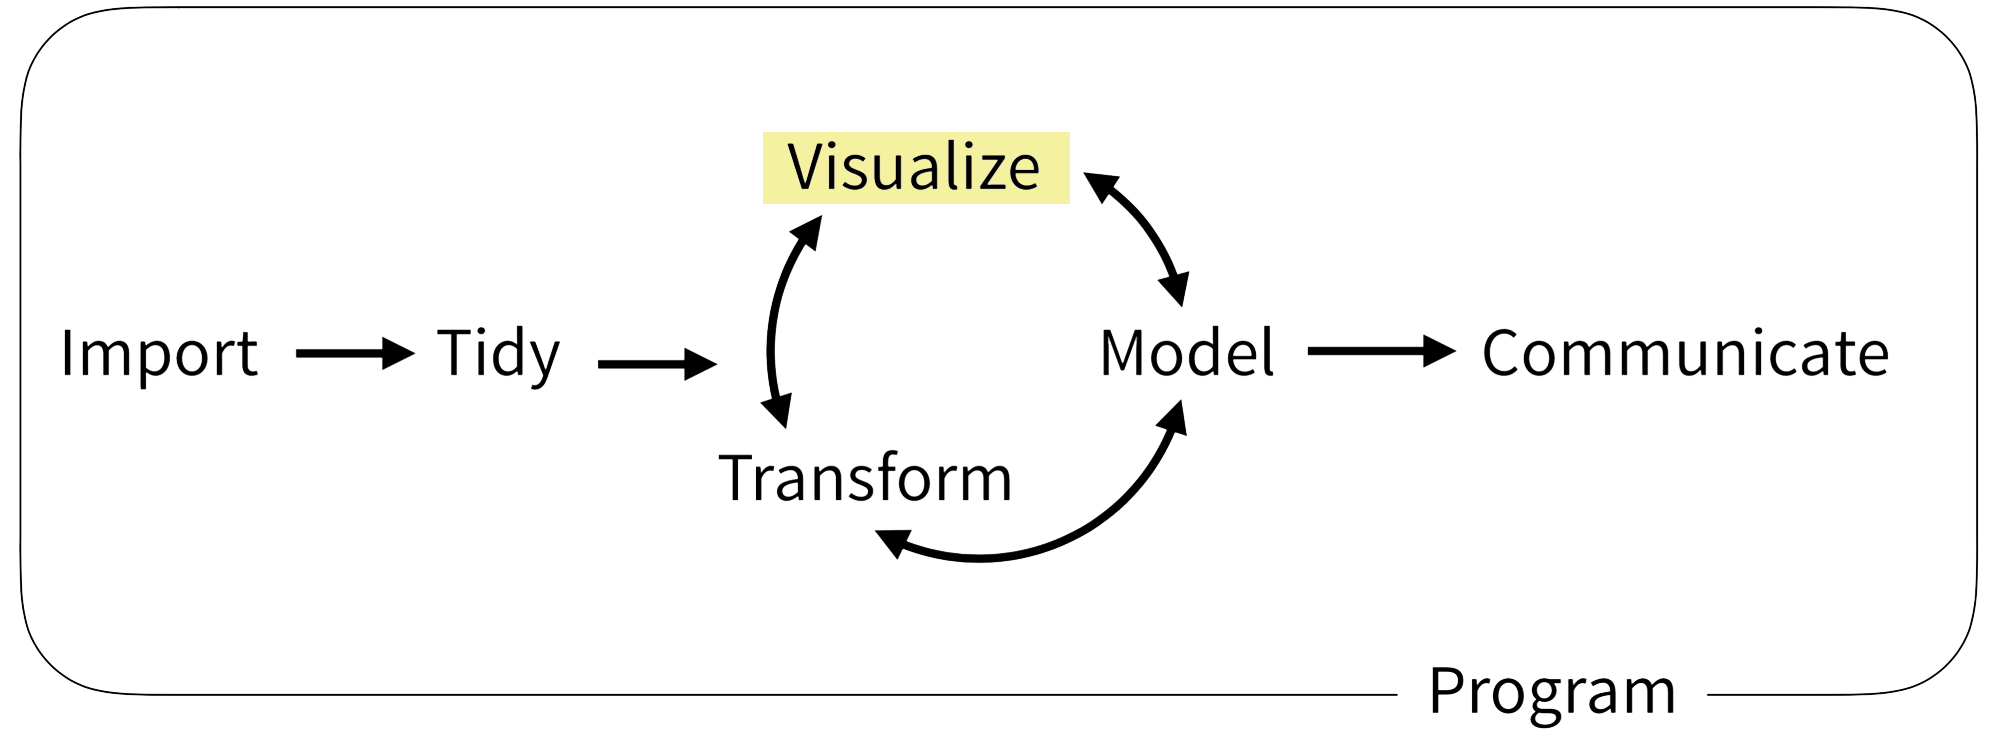
The Data Analysis Pipeline
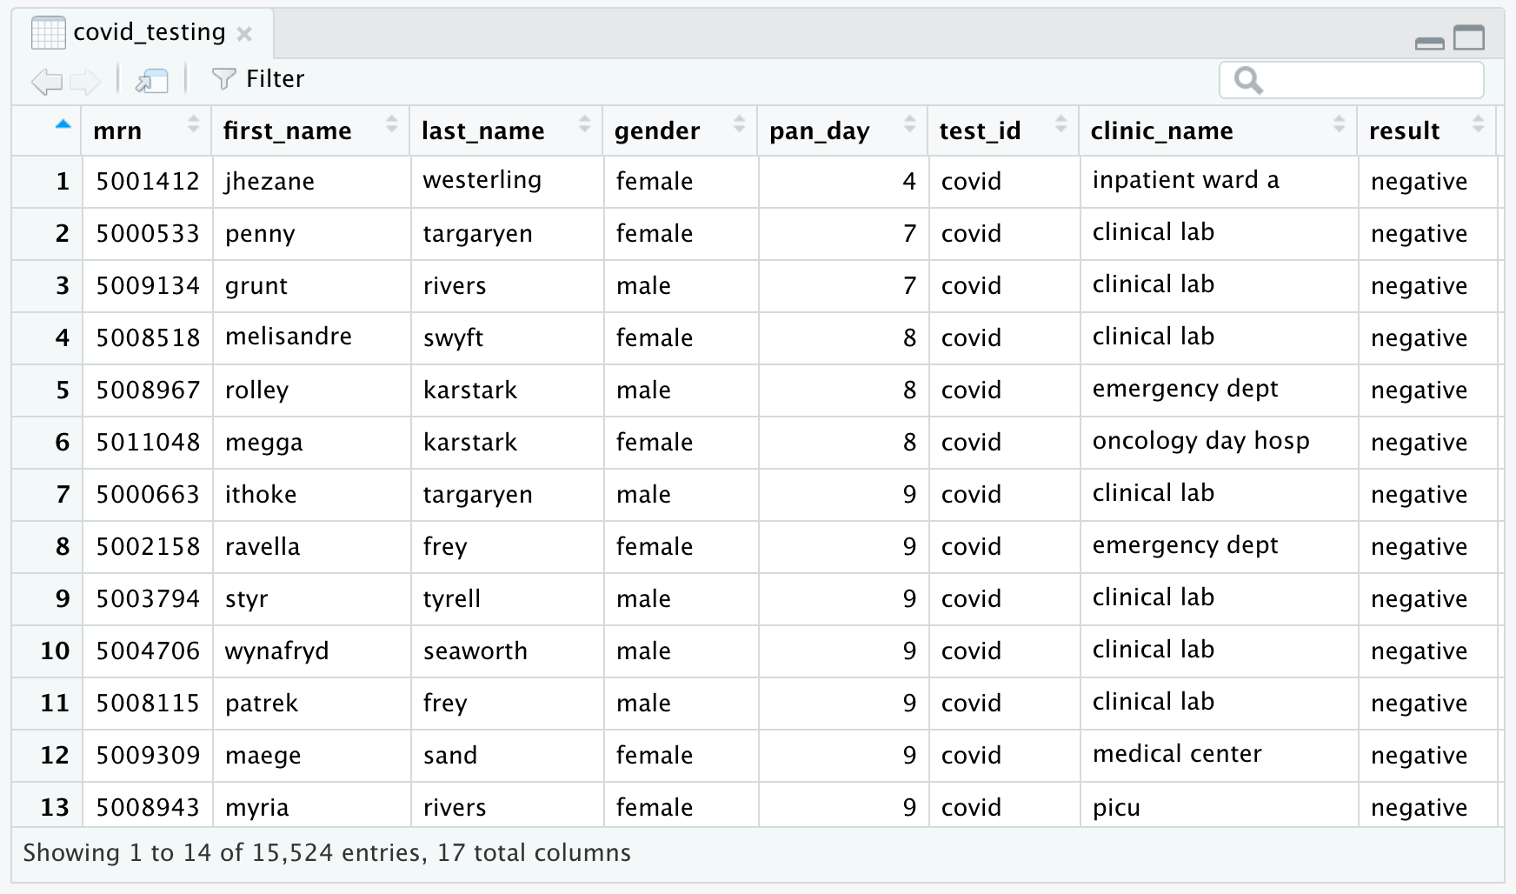
covid_testing
Your Turn #2
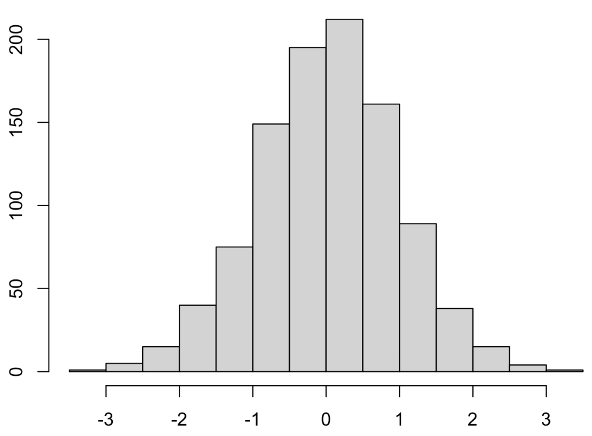
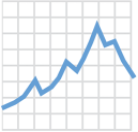
What is the name of this kind of plot?
Type the answer into the chat!
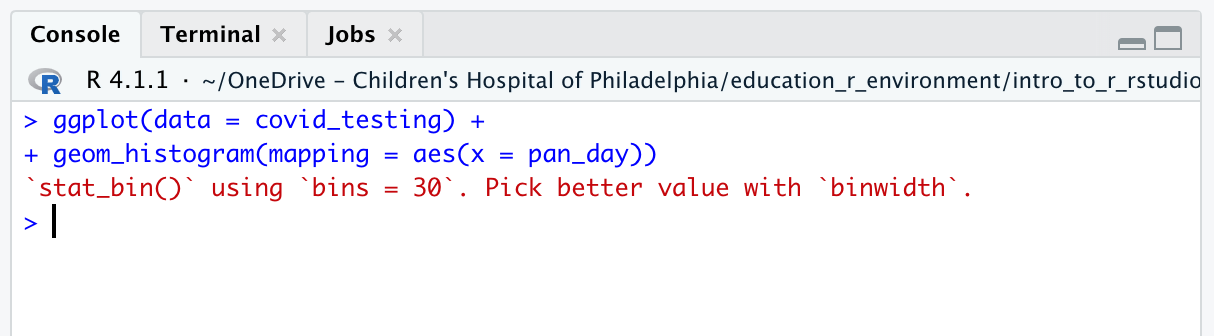
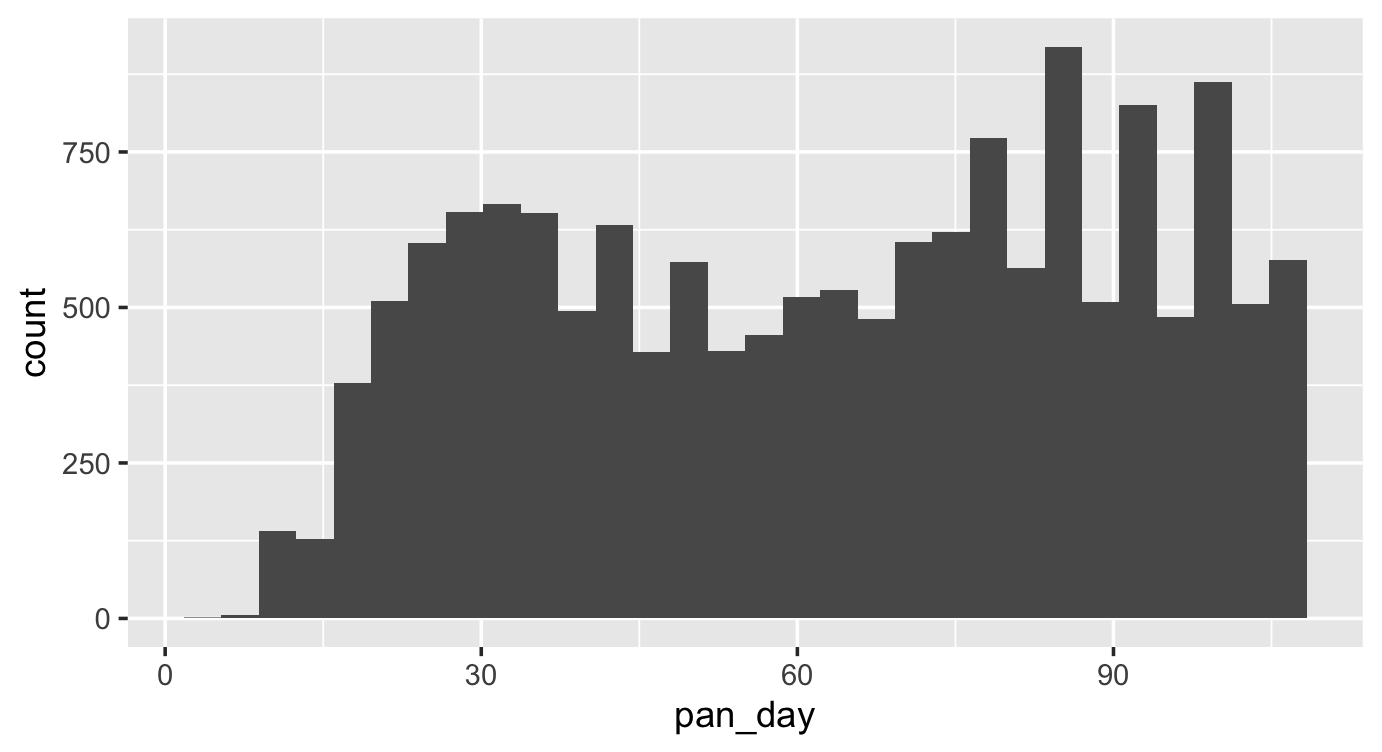
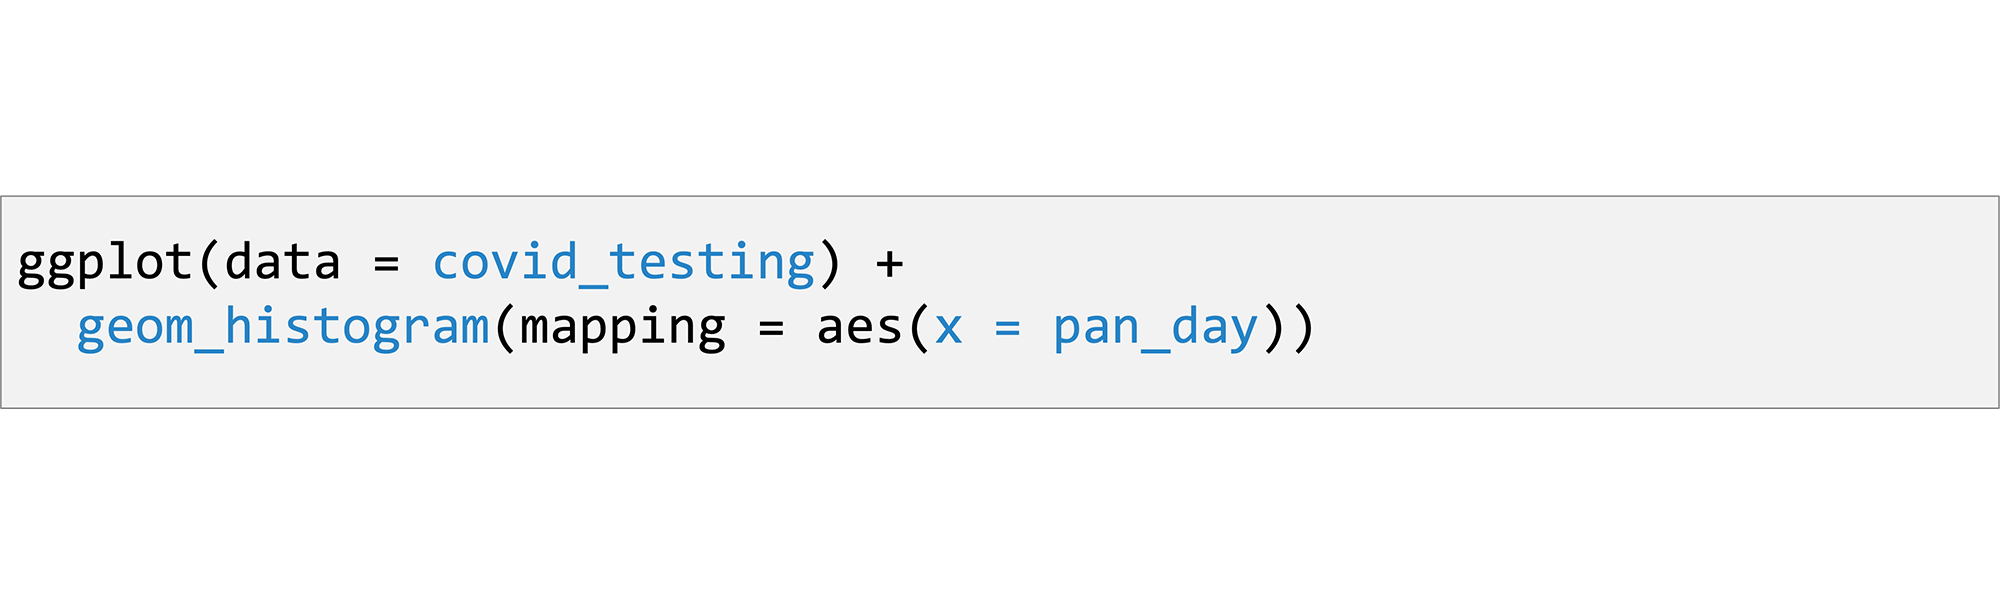
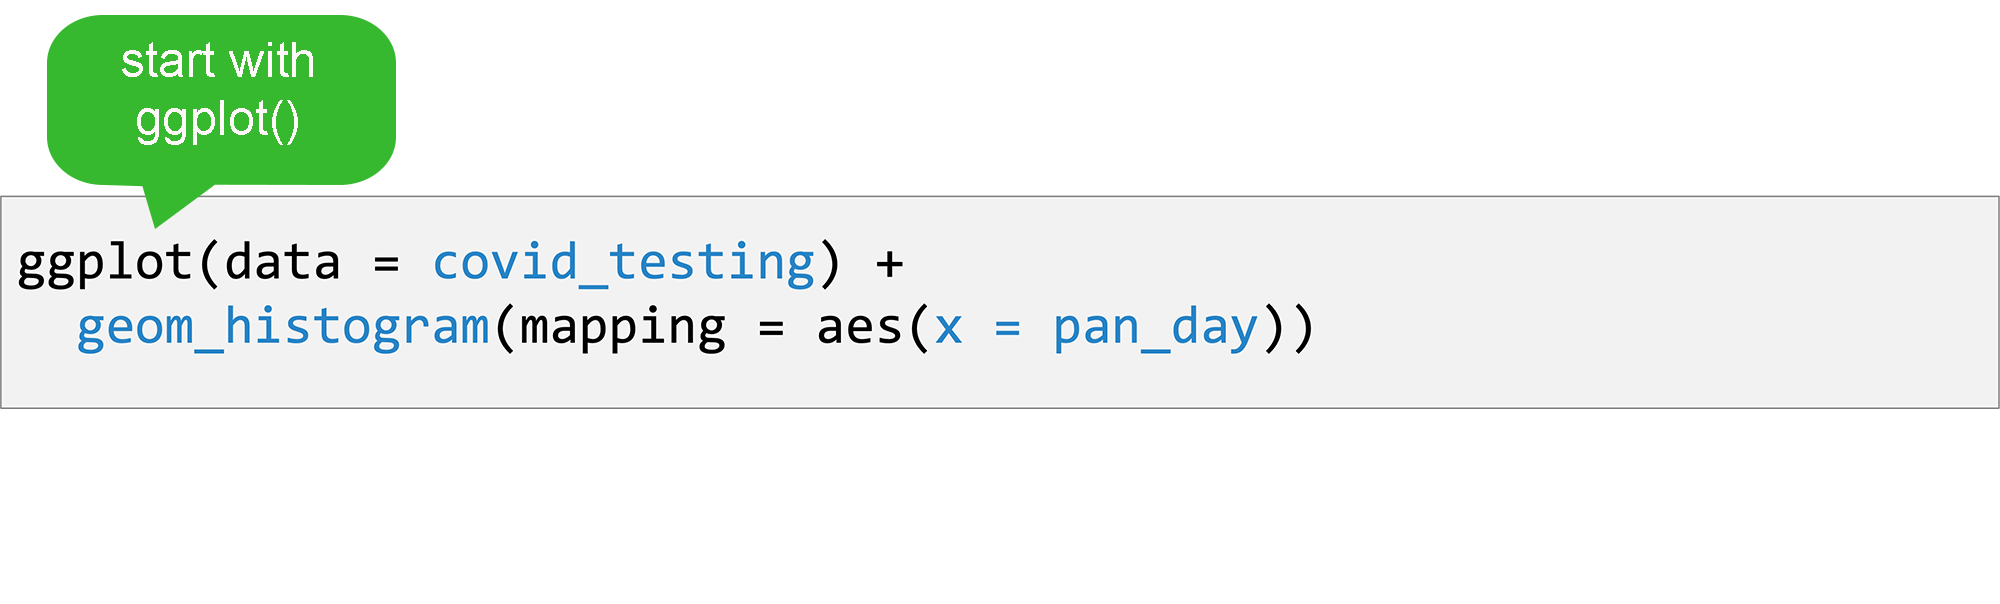
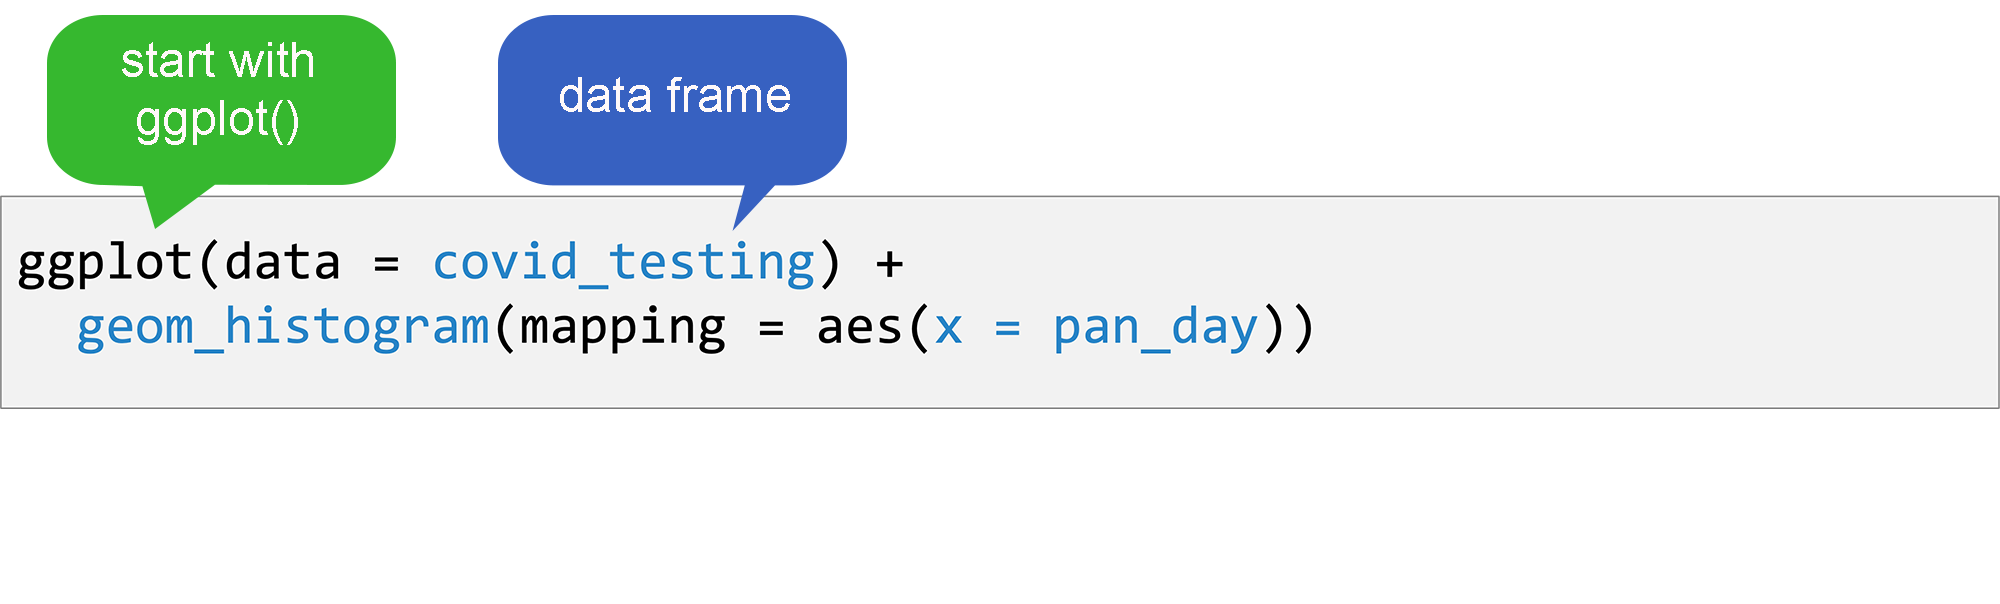
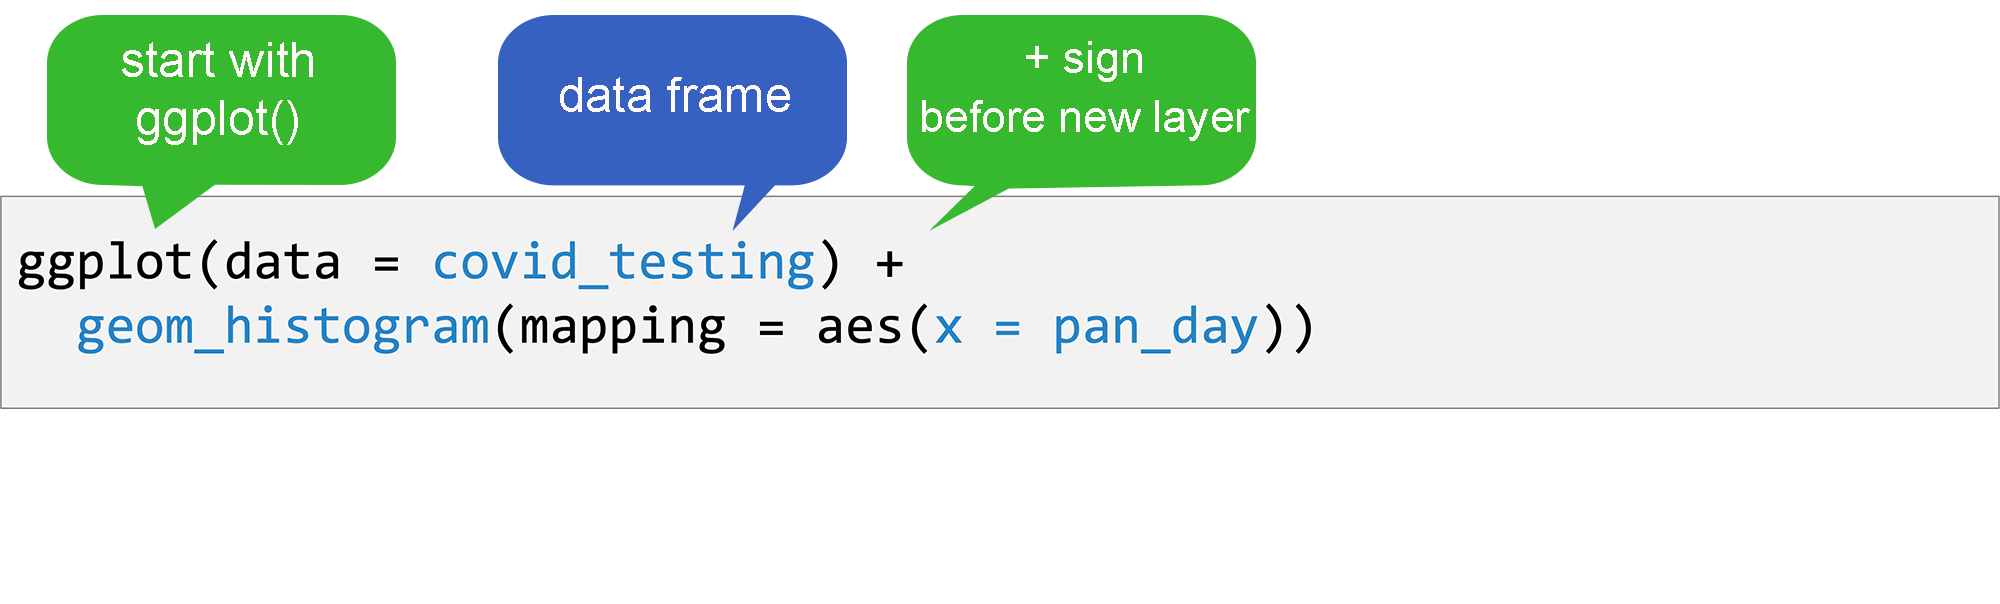
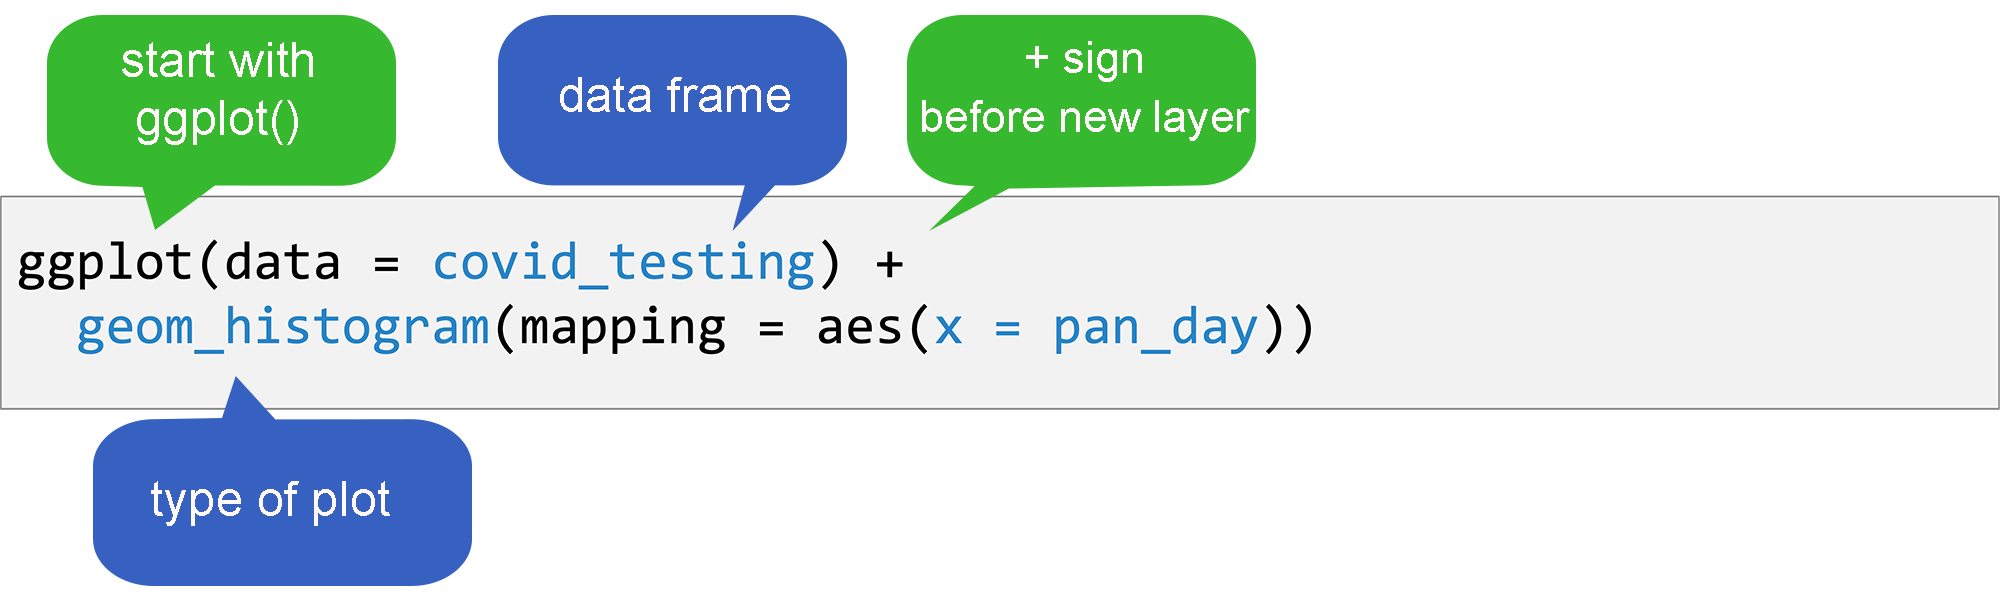
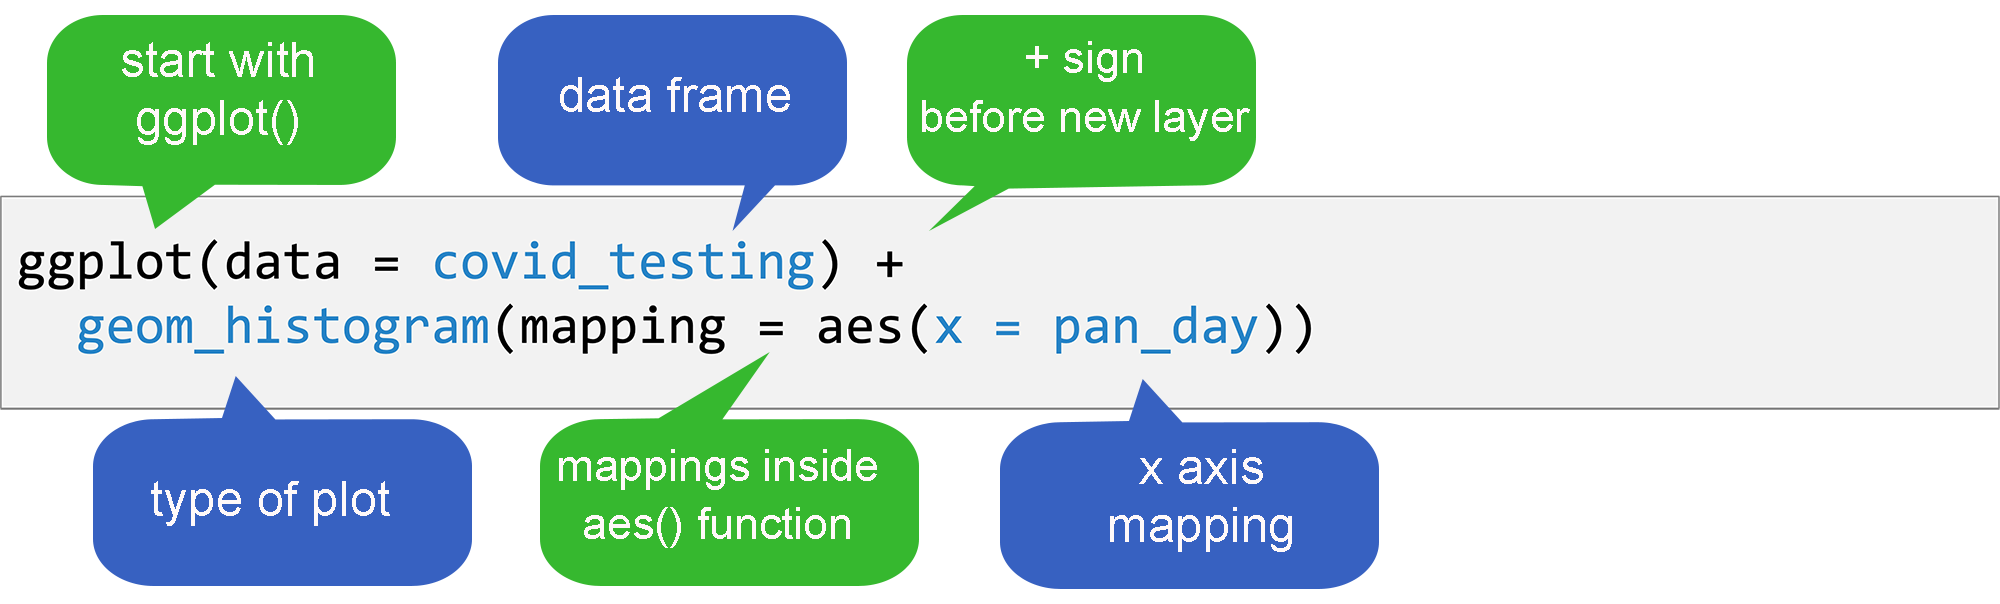
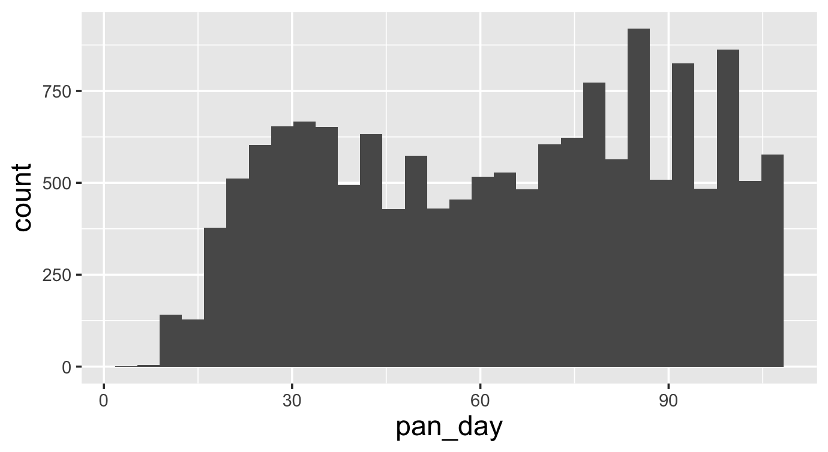
ggplot(data = covid_testing) +
  geom_histogram(mapping = aes(x = pan_day))
ggplot()
ggplot()
ggplot()
ggplot()
ggplot()
ggplot()

ggplot()
To Make Any Graph
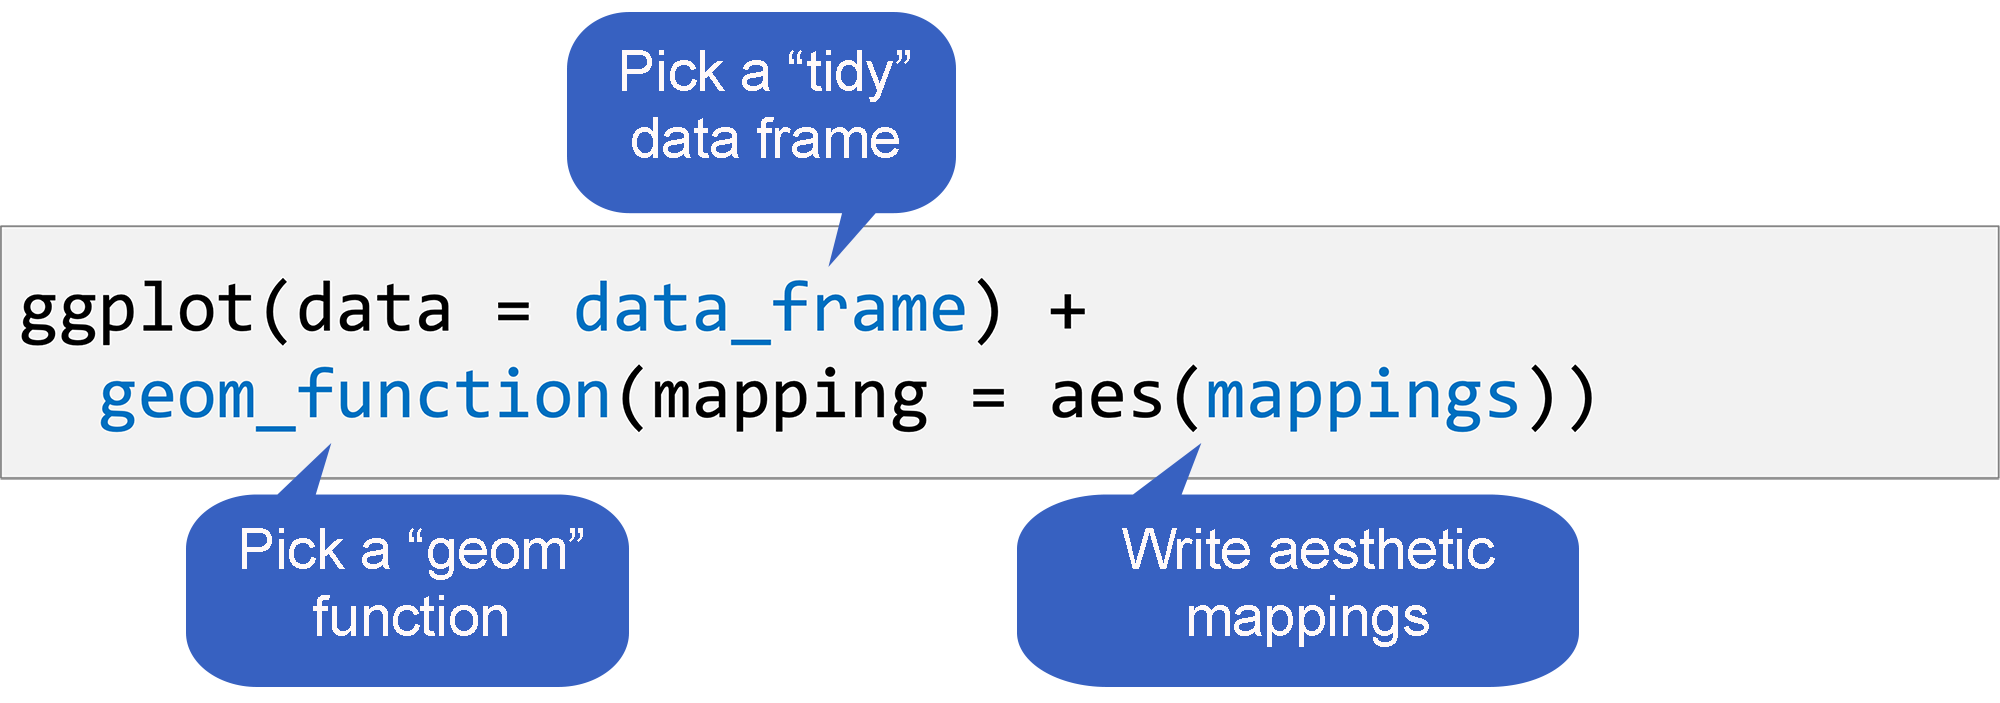
To Make Any Graph
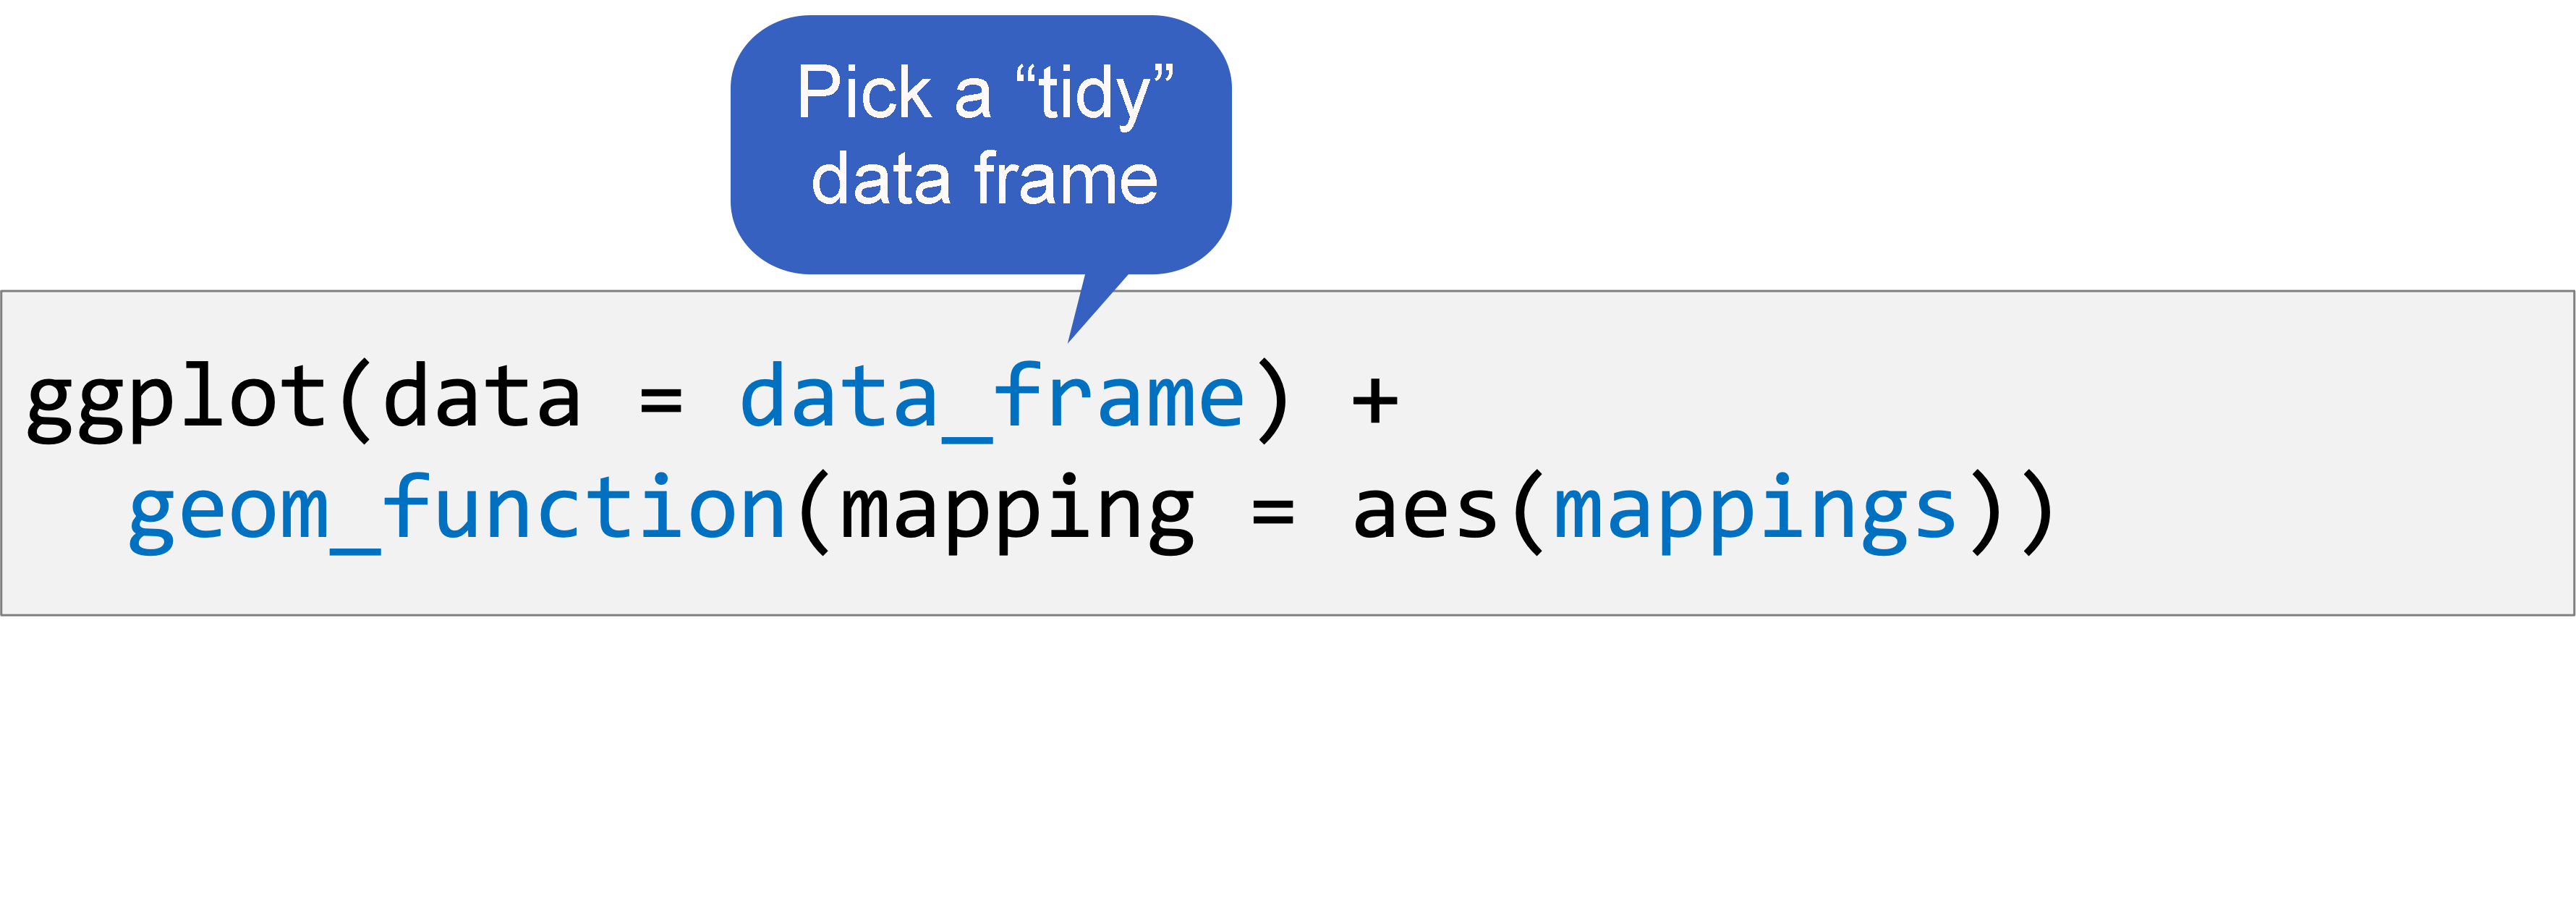
A Tidy Data Frame
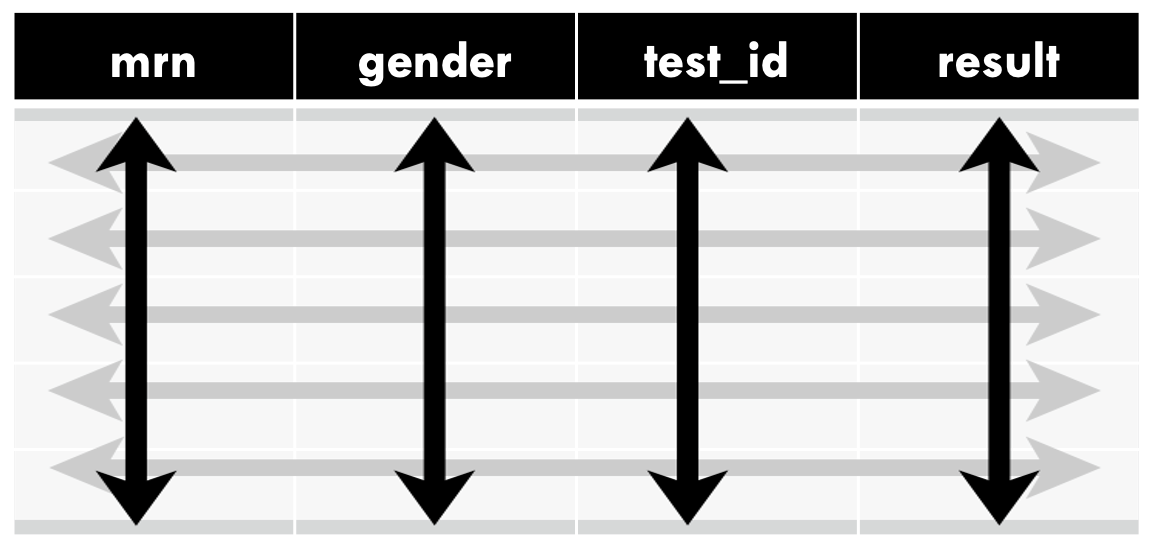
A data set is tidy if:
- Each variable is in its own column
- Each observation is in its own row
- Each value is in its own cell
To Make Any Graph:
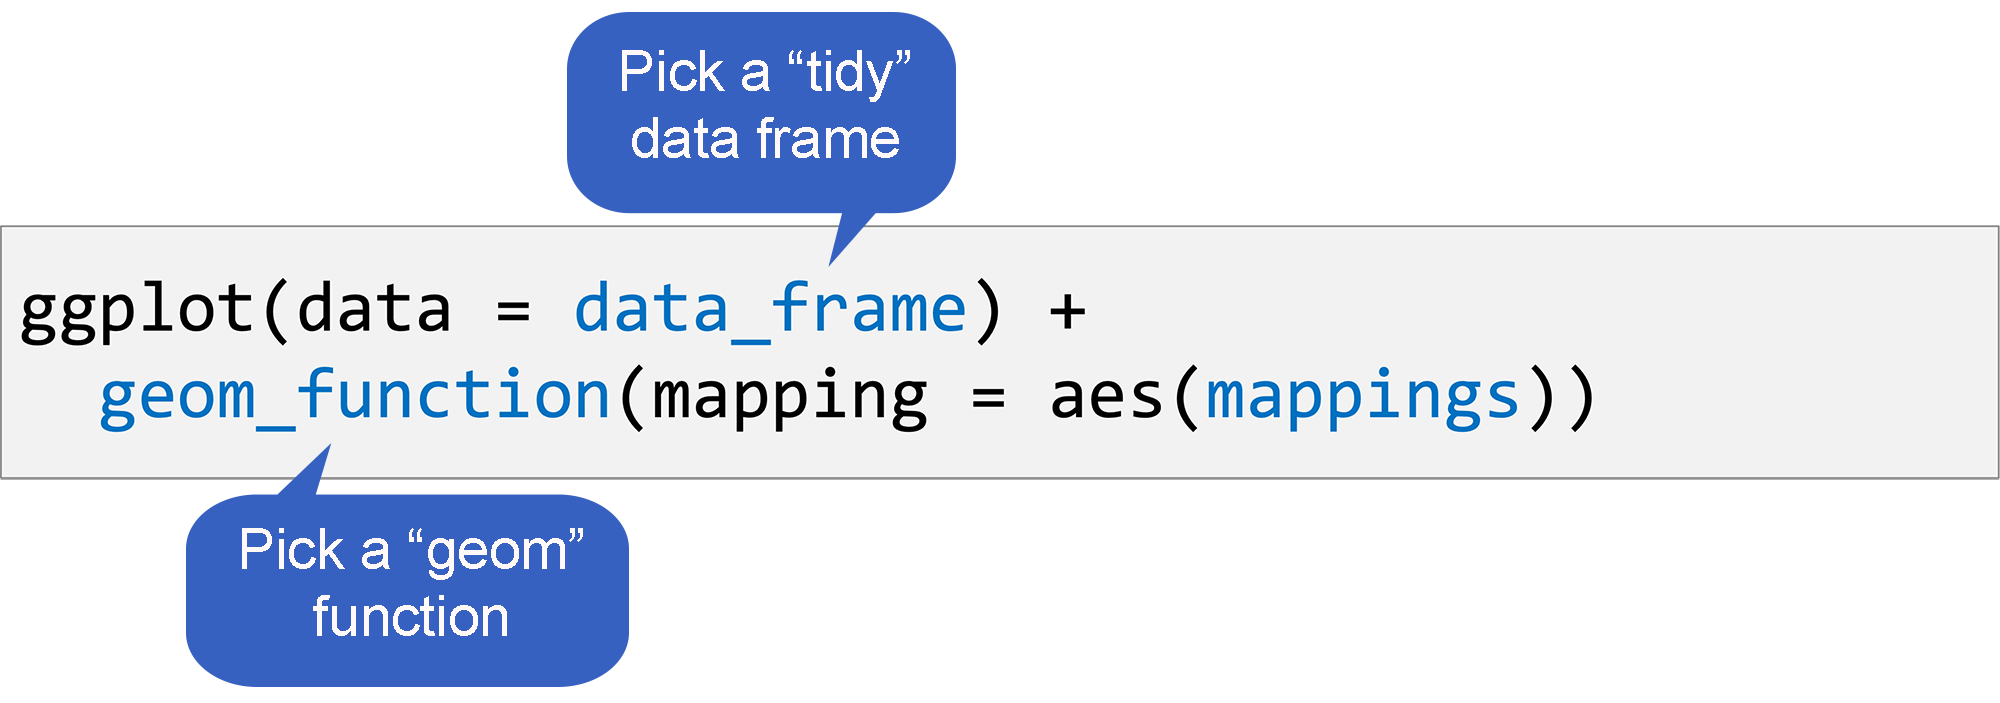
Geom Functions
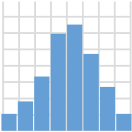
geom_histogram()
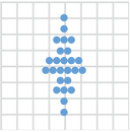
geom_dotplot()
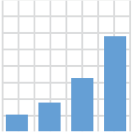
geom_bar()

geom_boxplot()
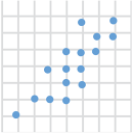
geom_point()
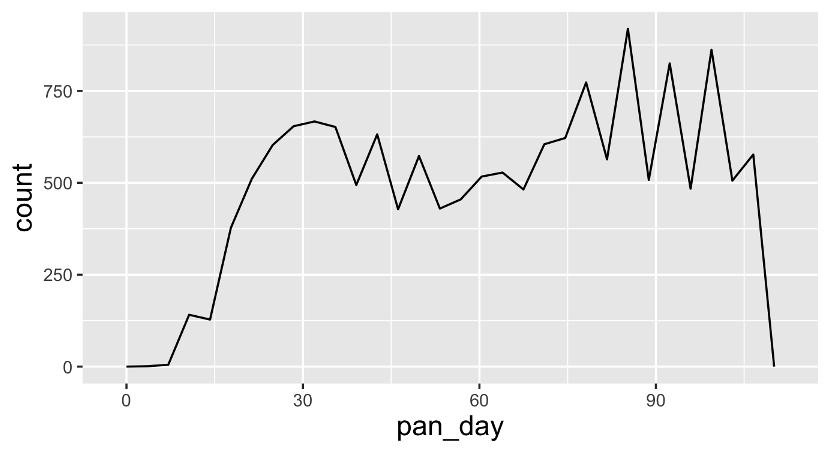
geom_line()
To Make Any Graph:
Aesthetics
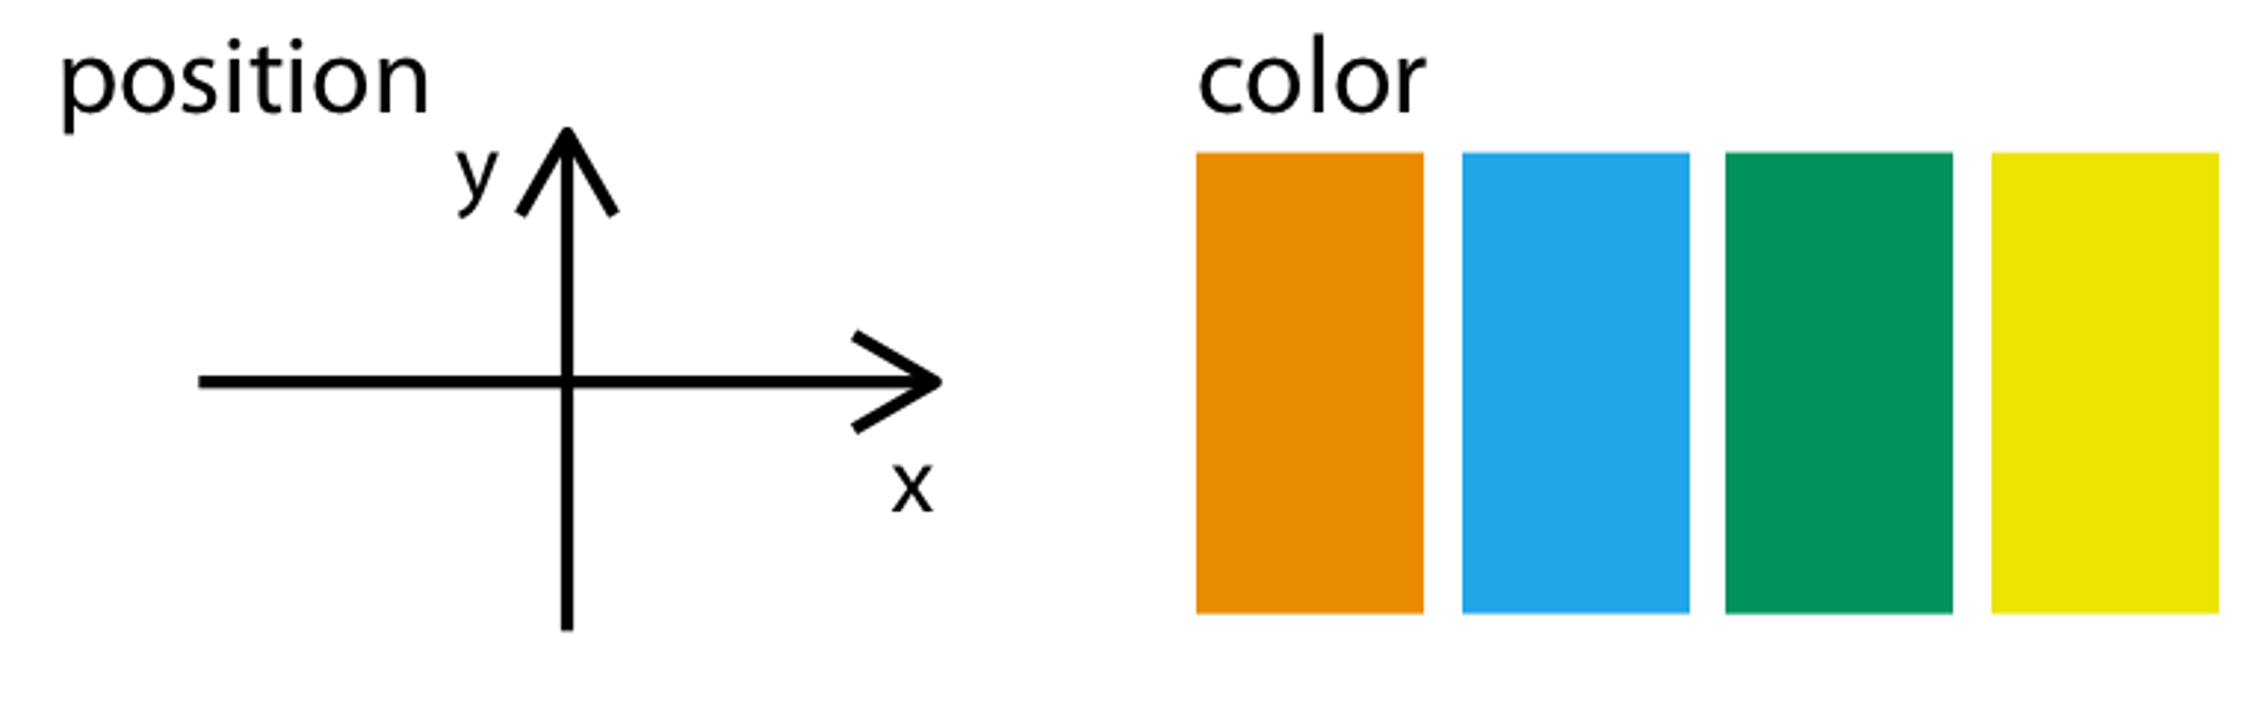
Aesthetic Mappings
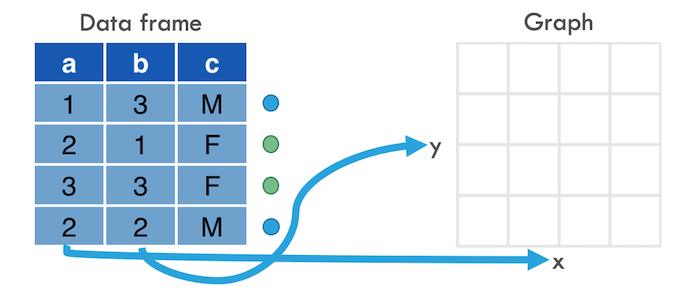
aes(x = a, y = b, color = c)
Your Turn #4
In addition to x/y position and color, what other aesthetic mappings can you think of?
(Hint: things that don’t change to fit the data, like the background color of a graph, aren’t mappings).
Type your answers in the chat!
Aesthetic Mappings
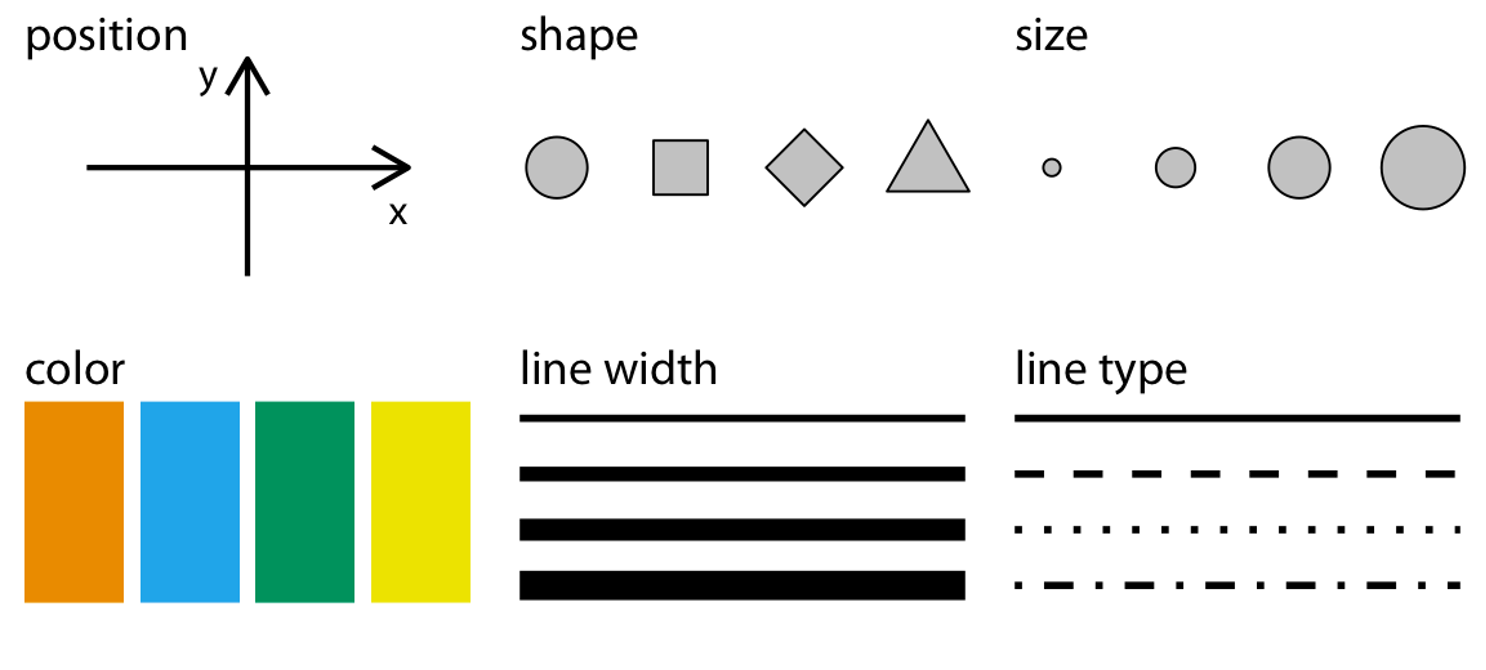
From Fundamentals of Data Visualization, by Claus Wilke, licensed under CC-BY-NC-ND
To Make Any Graph:
Your Turn #5
Open 02 - Visualize.Qmd. Work through the exercises of the section titled “Your Turn 5”.
Stop when it says “Stop Here”.
Click “yes”  when you’re done!
05:00
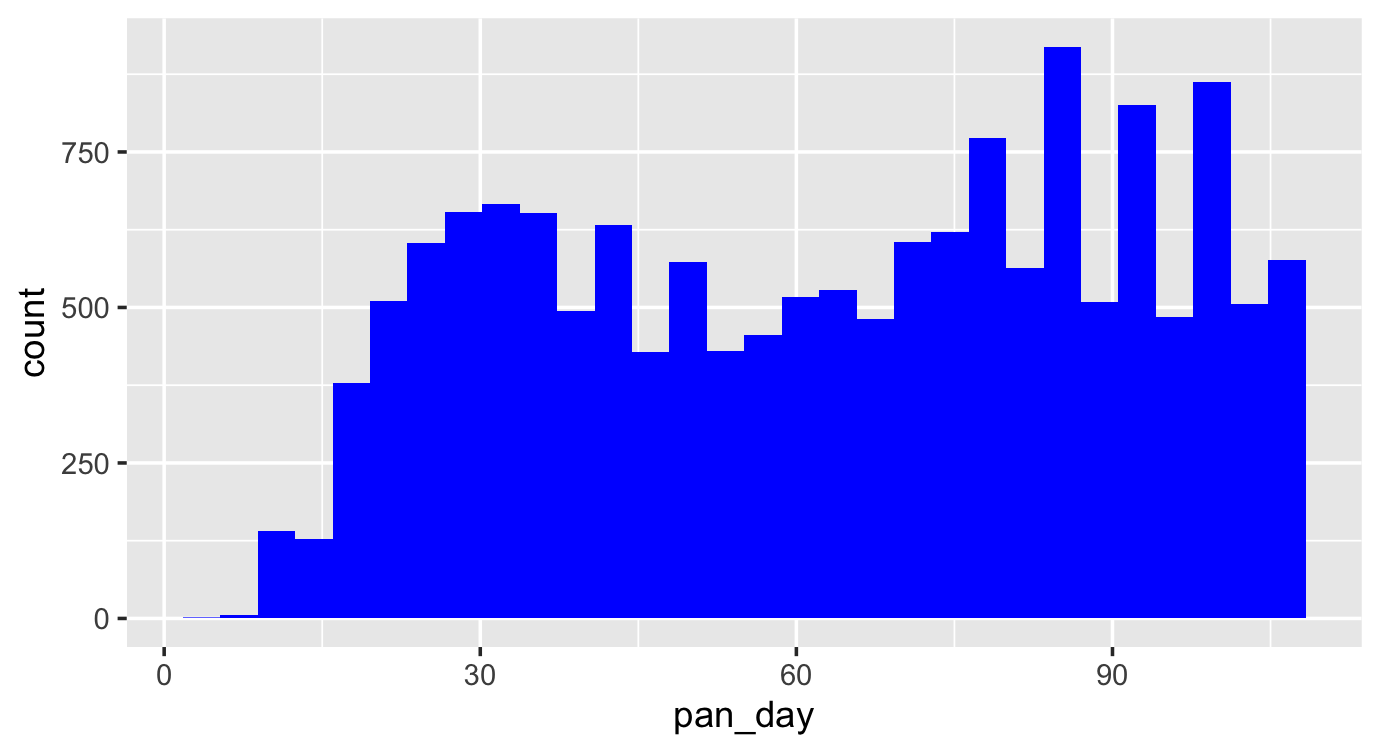
ggplot(data = covid_testing) +
  geom_histogram(mapping = aes(x = pan_day), fill = "blue")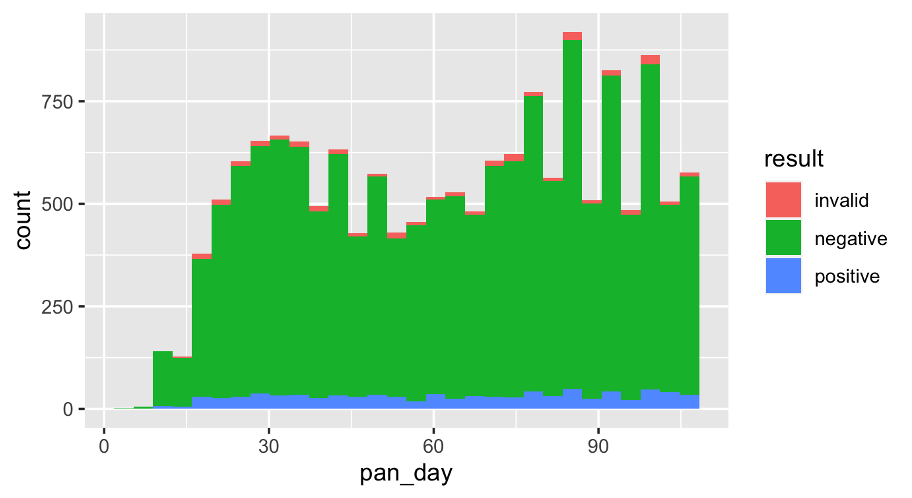
ggplot(data = covid_testing) +
  geom_histogram(mapping = aes(x = pan_day,
  fill = result))
Notice what’s inside the geom_histogram():
mapping = aes(x = pan_day, fill = result)Is “fill” inside or outside of mapping?
ggplot(data = covid_testing) +
  geom_histogram(mapping = aes(x = pan_day),
  fill = "blue")
Notice what’s inside the geom_histogram:
mapping = aes(x = pan_day), fill = "blue"Is “fill” inside or outside of mapping?
Your Turn #6
Return to 02 - Visualize.qmd. Work through the exercises of the section titled “Your Turn 6.”
Click “yes” when you’re done!
05:00
Recap
ggplot2 is a package that provides a grammar of graphics. You can create any type of plot using a simple template to which you provide:
A tidy data frame, in which each variable is in its own column, each observation is in its own row, each value is in its own cell;
A geom function, which tells R what kind of plot to make; and
Aesthetic mappings, which tell R how to represent data as graphical markings on the plot.
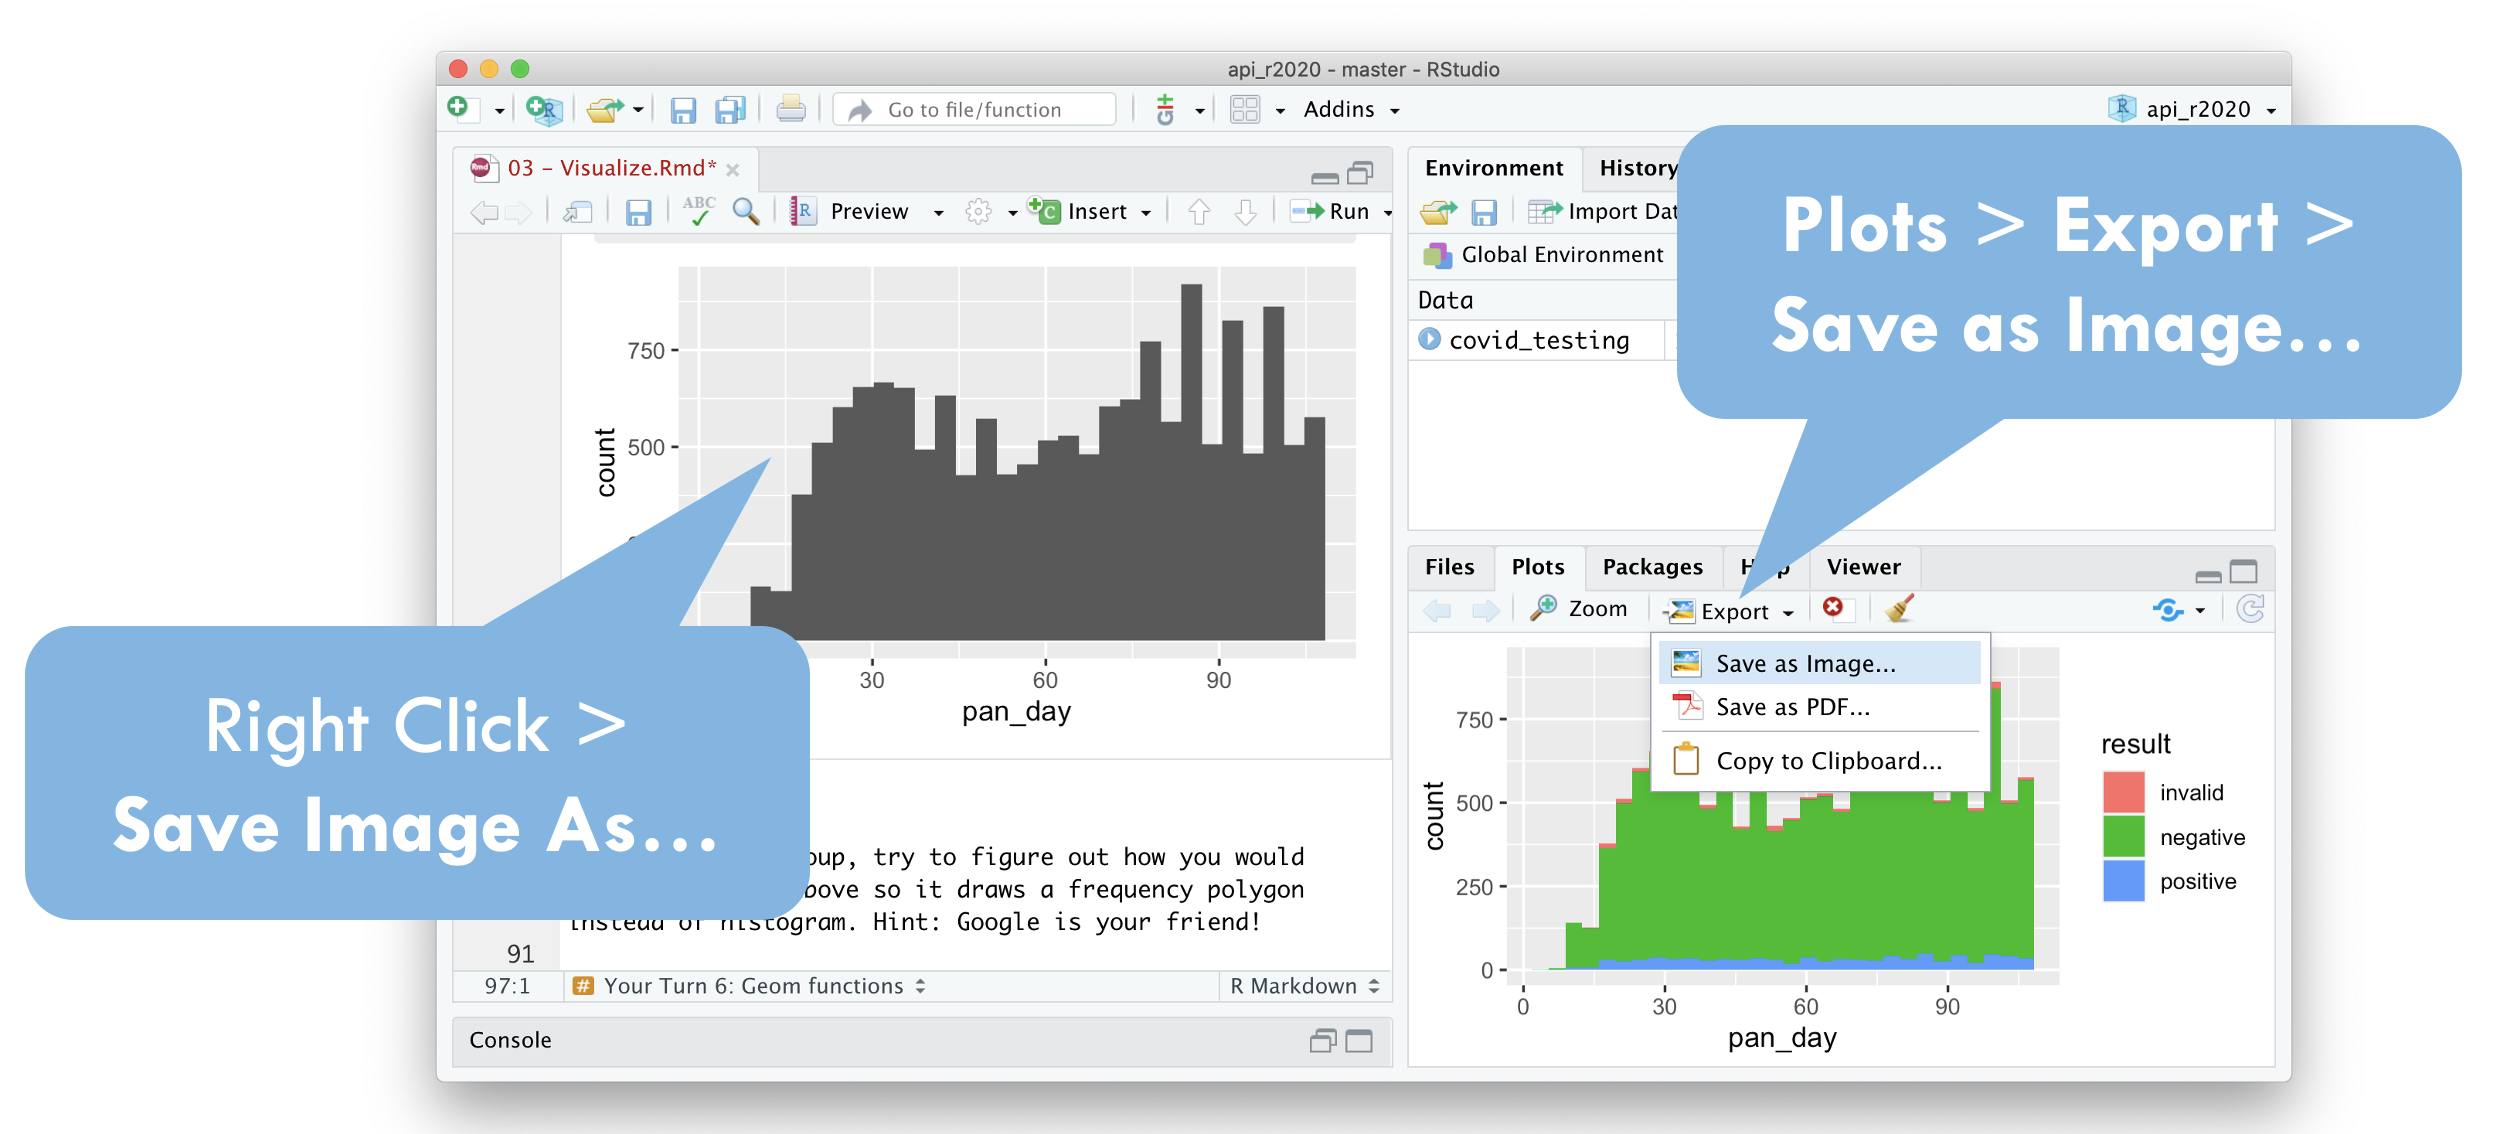
Saving Plots
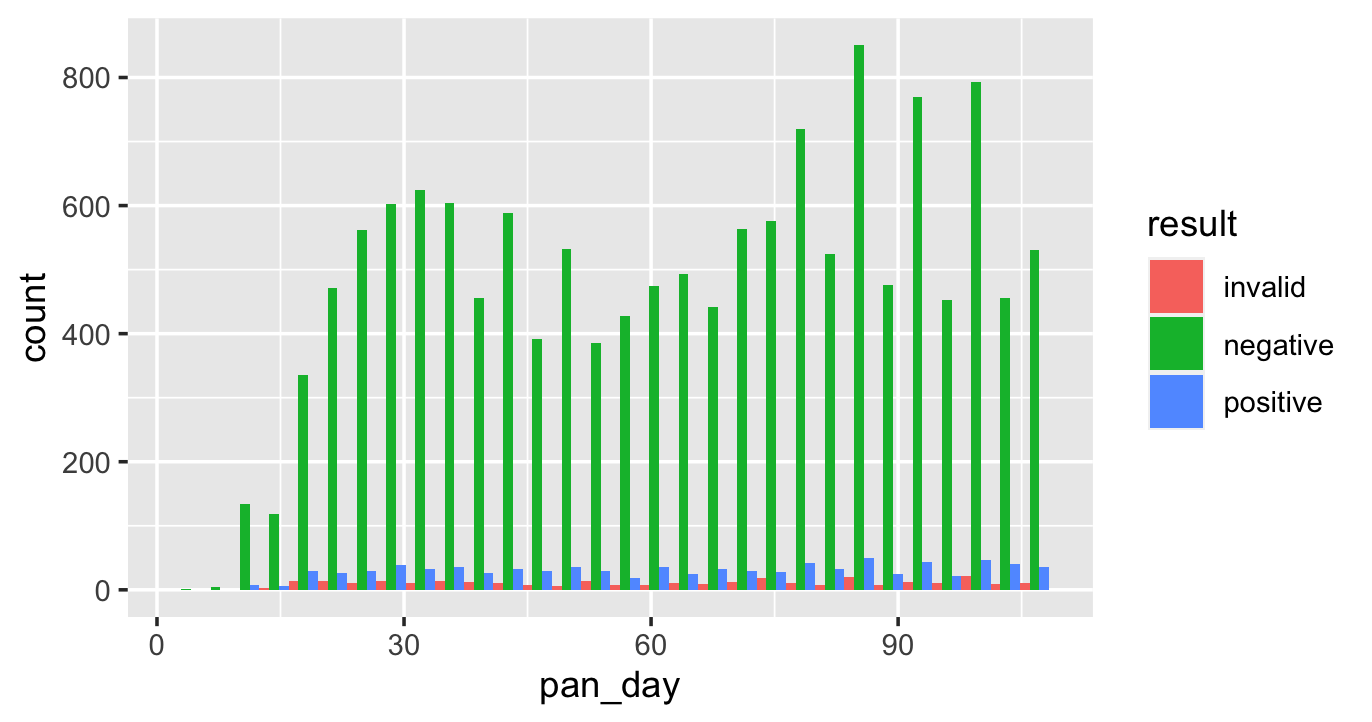
Position Adjustments
ggplot(covid_testing) +
  geom_histogram(
    mapping = aes(x = pan_day, fill = result),
    position = position_dodge()
  )
Themes
ggplot(covid_testing) +
  geom_histogram(
    mapping = aes(x = pan_day, fill = result),
    position = position_dodge()
  ) +
  theme_light()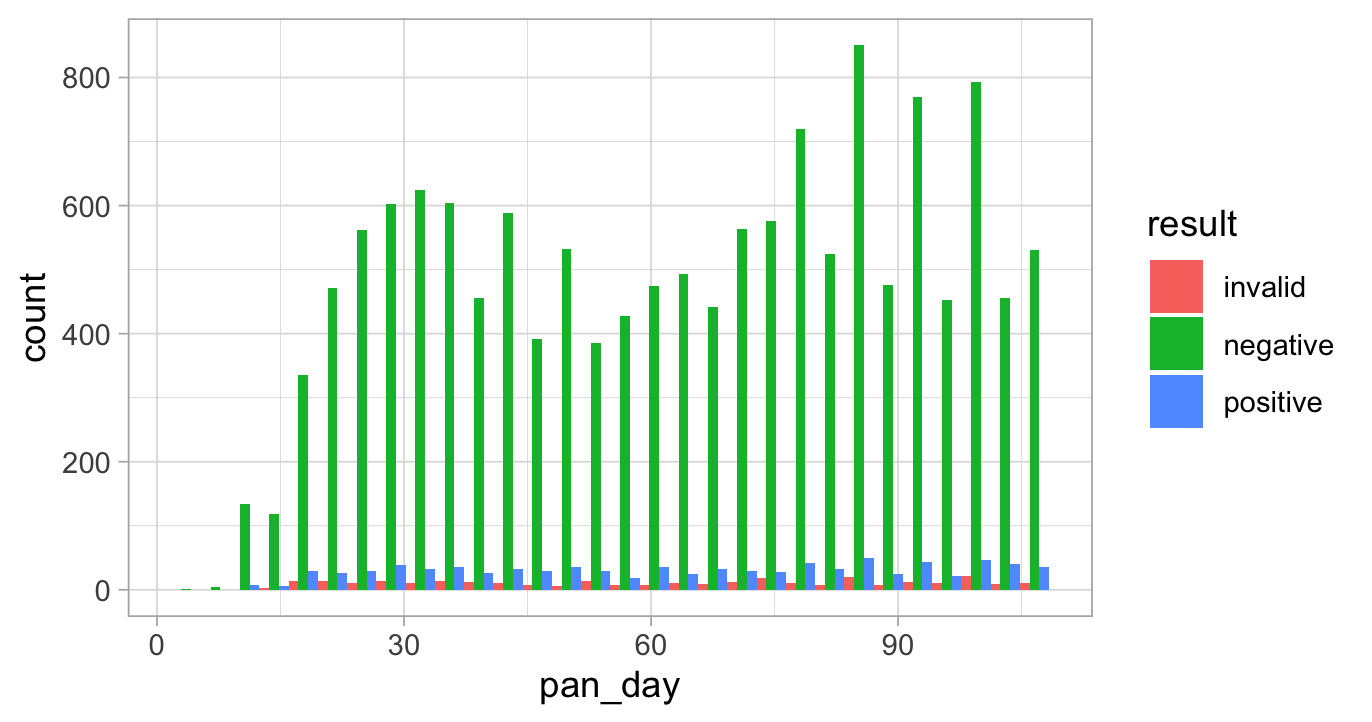
Scales
library(colorspace)

cols <- c(
  "invalid" = "grey80",
  qualitative_hcl(2, palette = "dark3")
)

ggplot(covid_testing) +
  geom_histogram(
    mapping = aes(x = pan_day, fill = result),
    position = position_dodge()
  ) +
  theme_light() +
  scale_fill_manual(values = cols)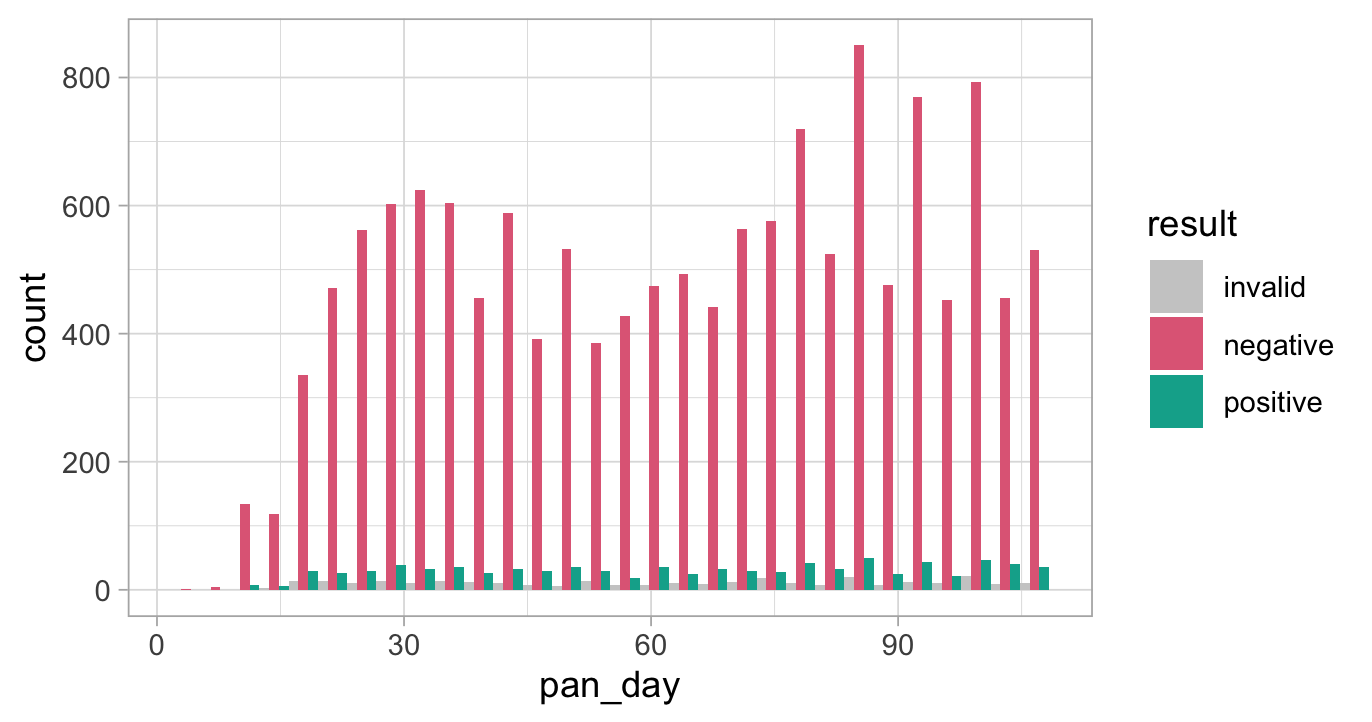
Facets
ggplot(covid_testing) +
  geom_histogram(
    mapping = aes(x = pan_day, fill = result)
  ) +
  theme_light() +
  scale_fill_manual(values = cols) +
  facet_wrap(~demo_group)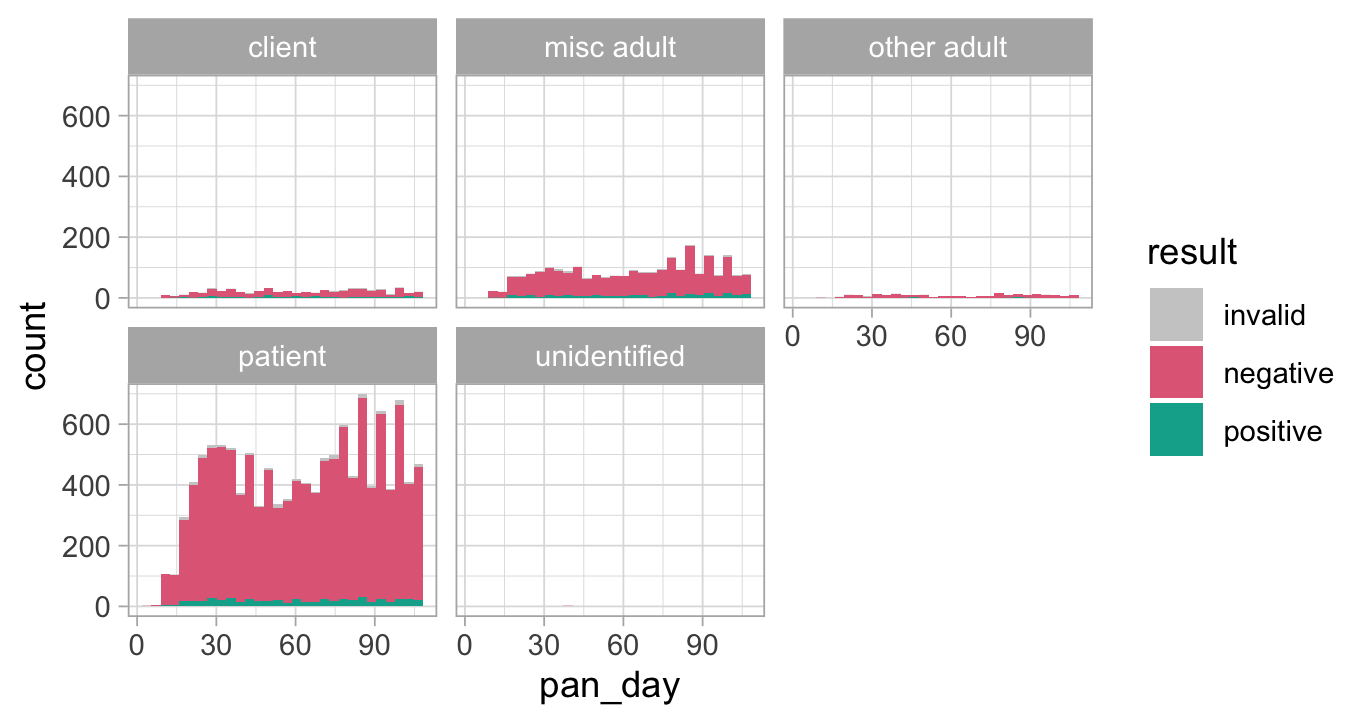
Coordinate Systems
ggplot(covid_testing) +
  geom_histogram(
    mapping = aes(x = pan_day, fill = result)
  ) +
  theme_light() +
  scale_fill_manual(values = cols) +
  facet_wrap(~demo_group) +
  coord_polar()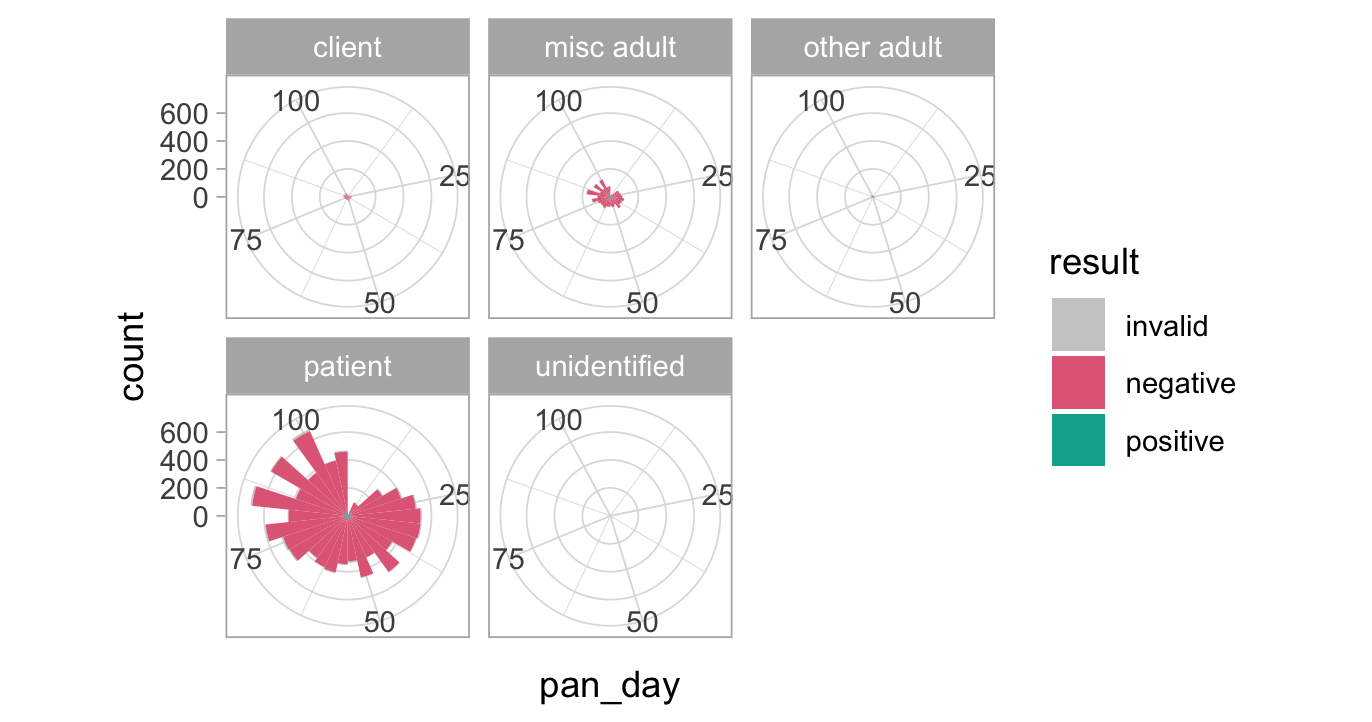
Titles and Captions
ggplot(covid_testing) +
    geom_histogram(
        mapping = aes(x = pan_day, fill = result)
    ) +
    theme_light() +
    facet_wrap(~demo_group) +
    ggtitle(label = "COVID19 Test Volume",
         subtitle = "Faceted by Demographic Group") +
    xlab("Day of Pandemic") +
    ylab("Number of Tests")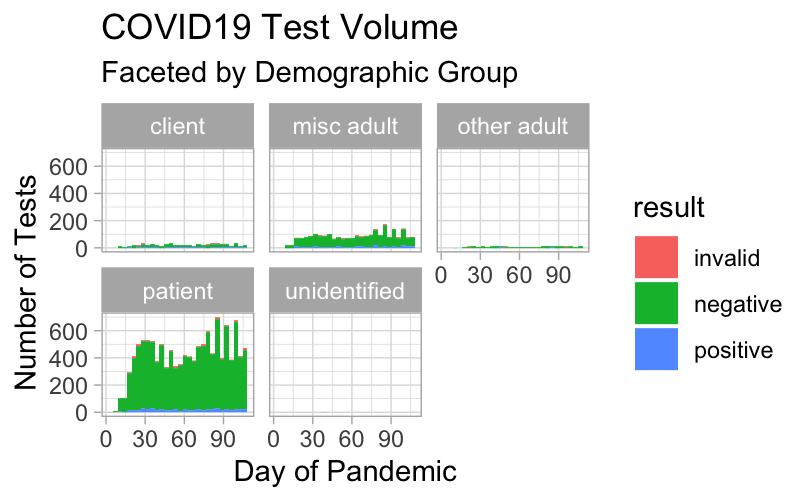
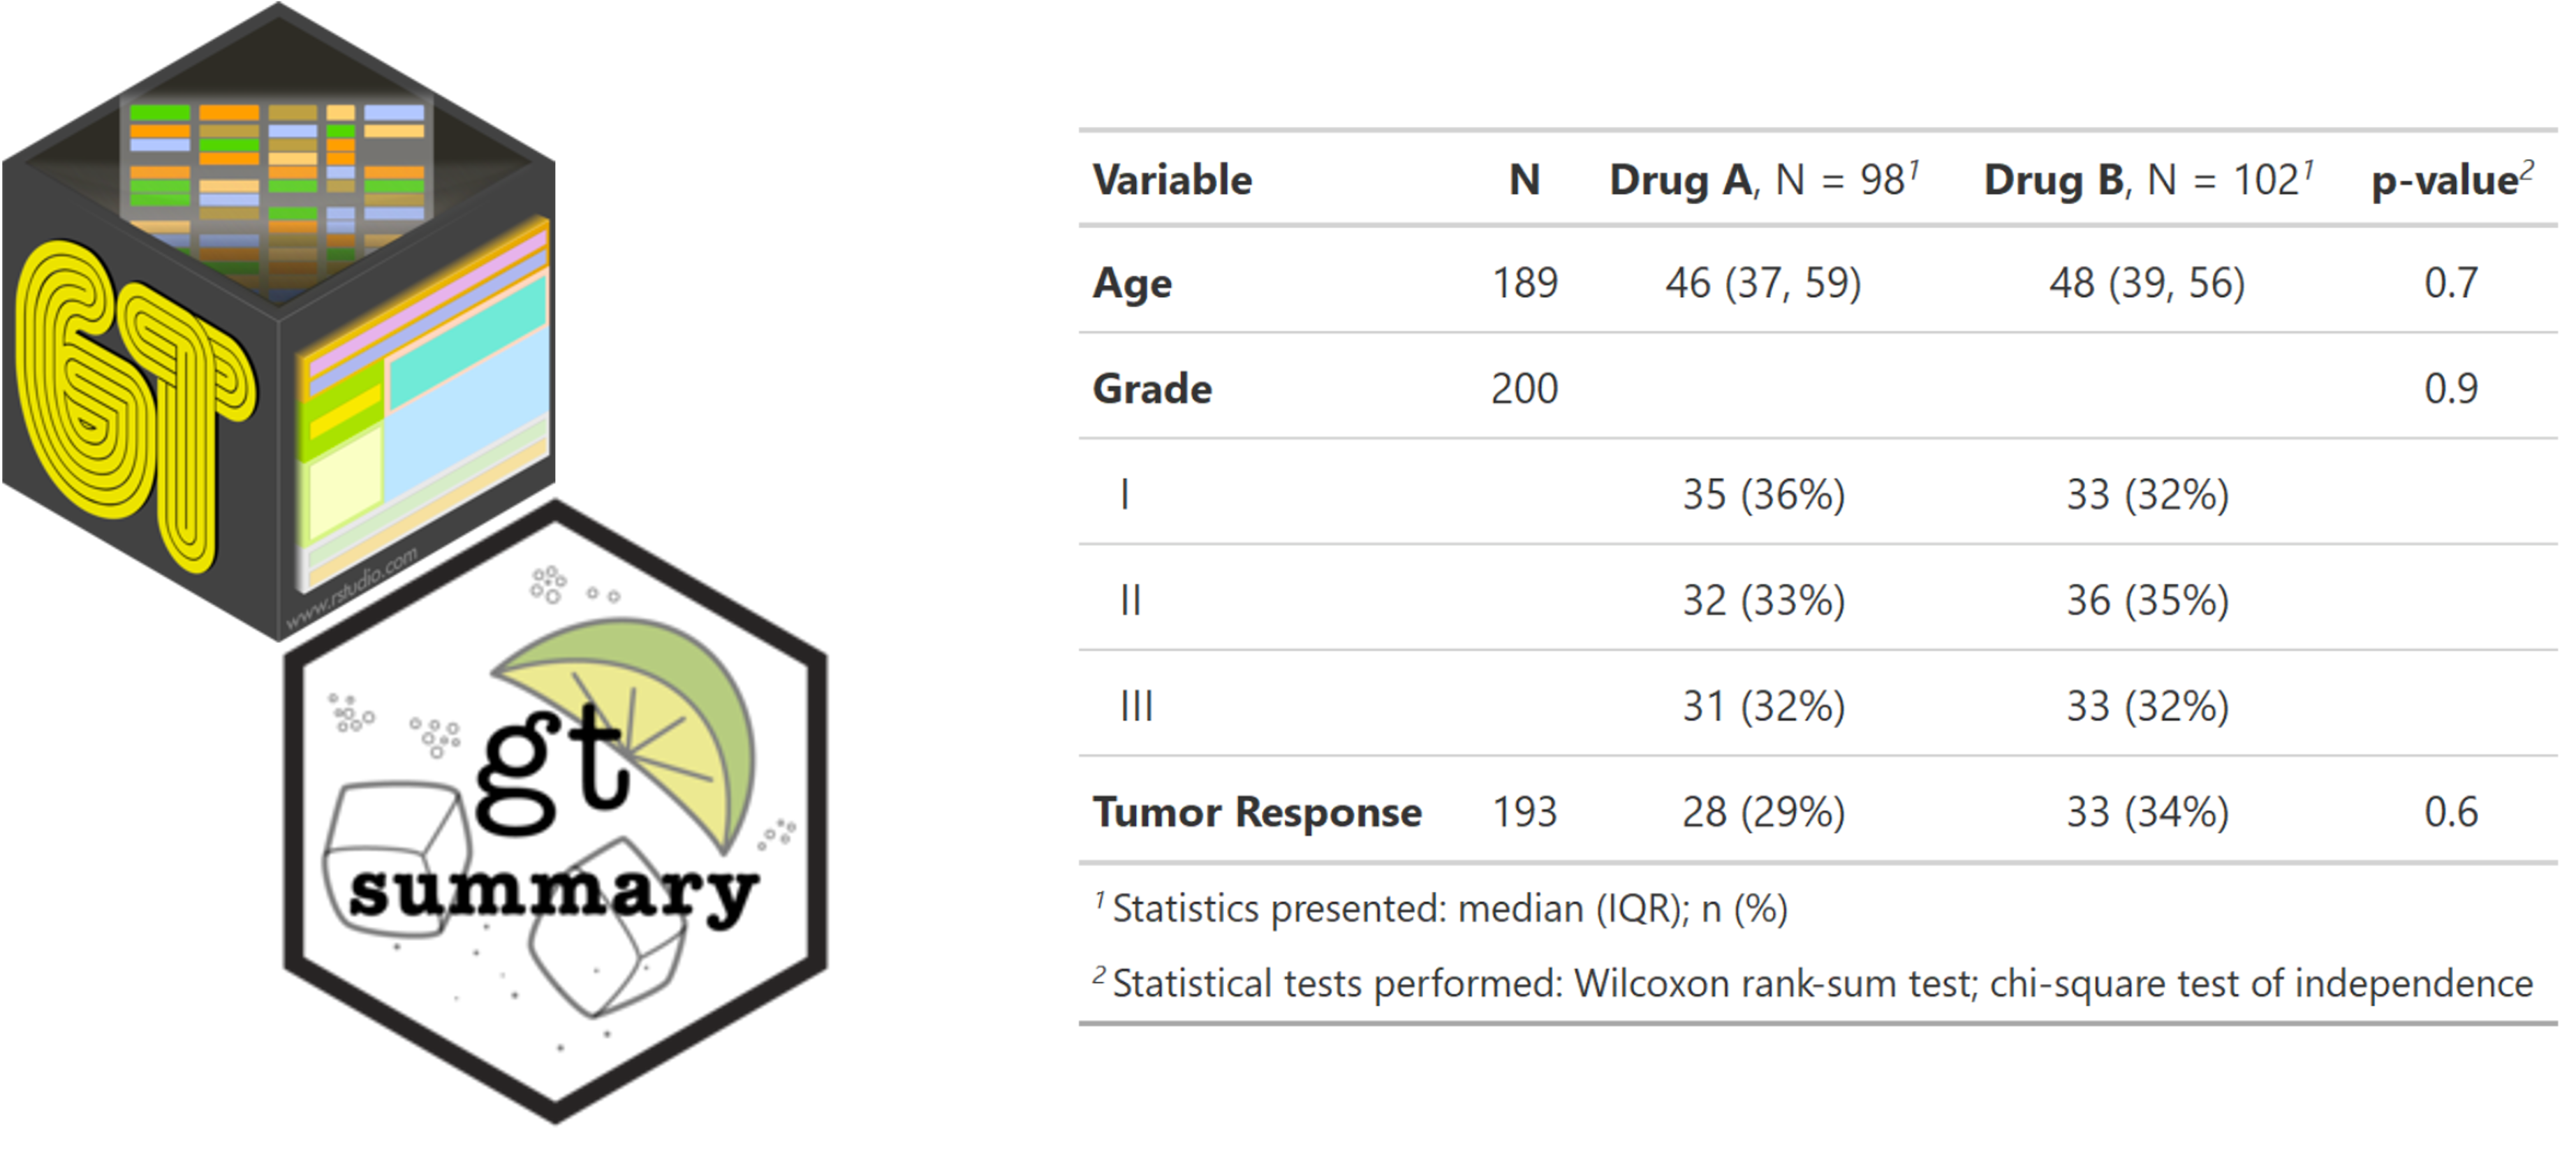
A Grammar for Tables
Next Up: Transform
Our next topic is: