01:00
![]()
![]()

R Programming language for data analysis
RStudio Integrated development environment (IDE)
Quarto Computational document format
RStudio: On the Web and on Your Desktop
![]()

![]()

Posit.cloud
Hosted by Posit (in the cloud)
Posit Workbench
Hosted by you, your company, your university, on prem or in the cloud
RStudio Desktop
Installed on your computer
Your Turn #1
Go to https://posit.cloud/content/6121691 in your browser. If you’re not already logged in, log in to Posit.cloud.

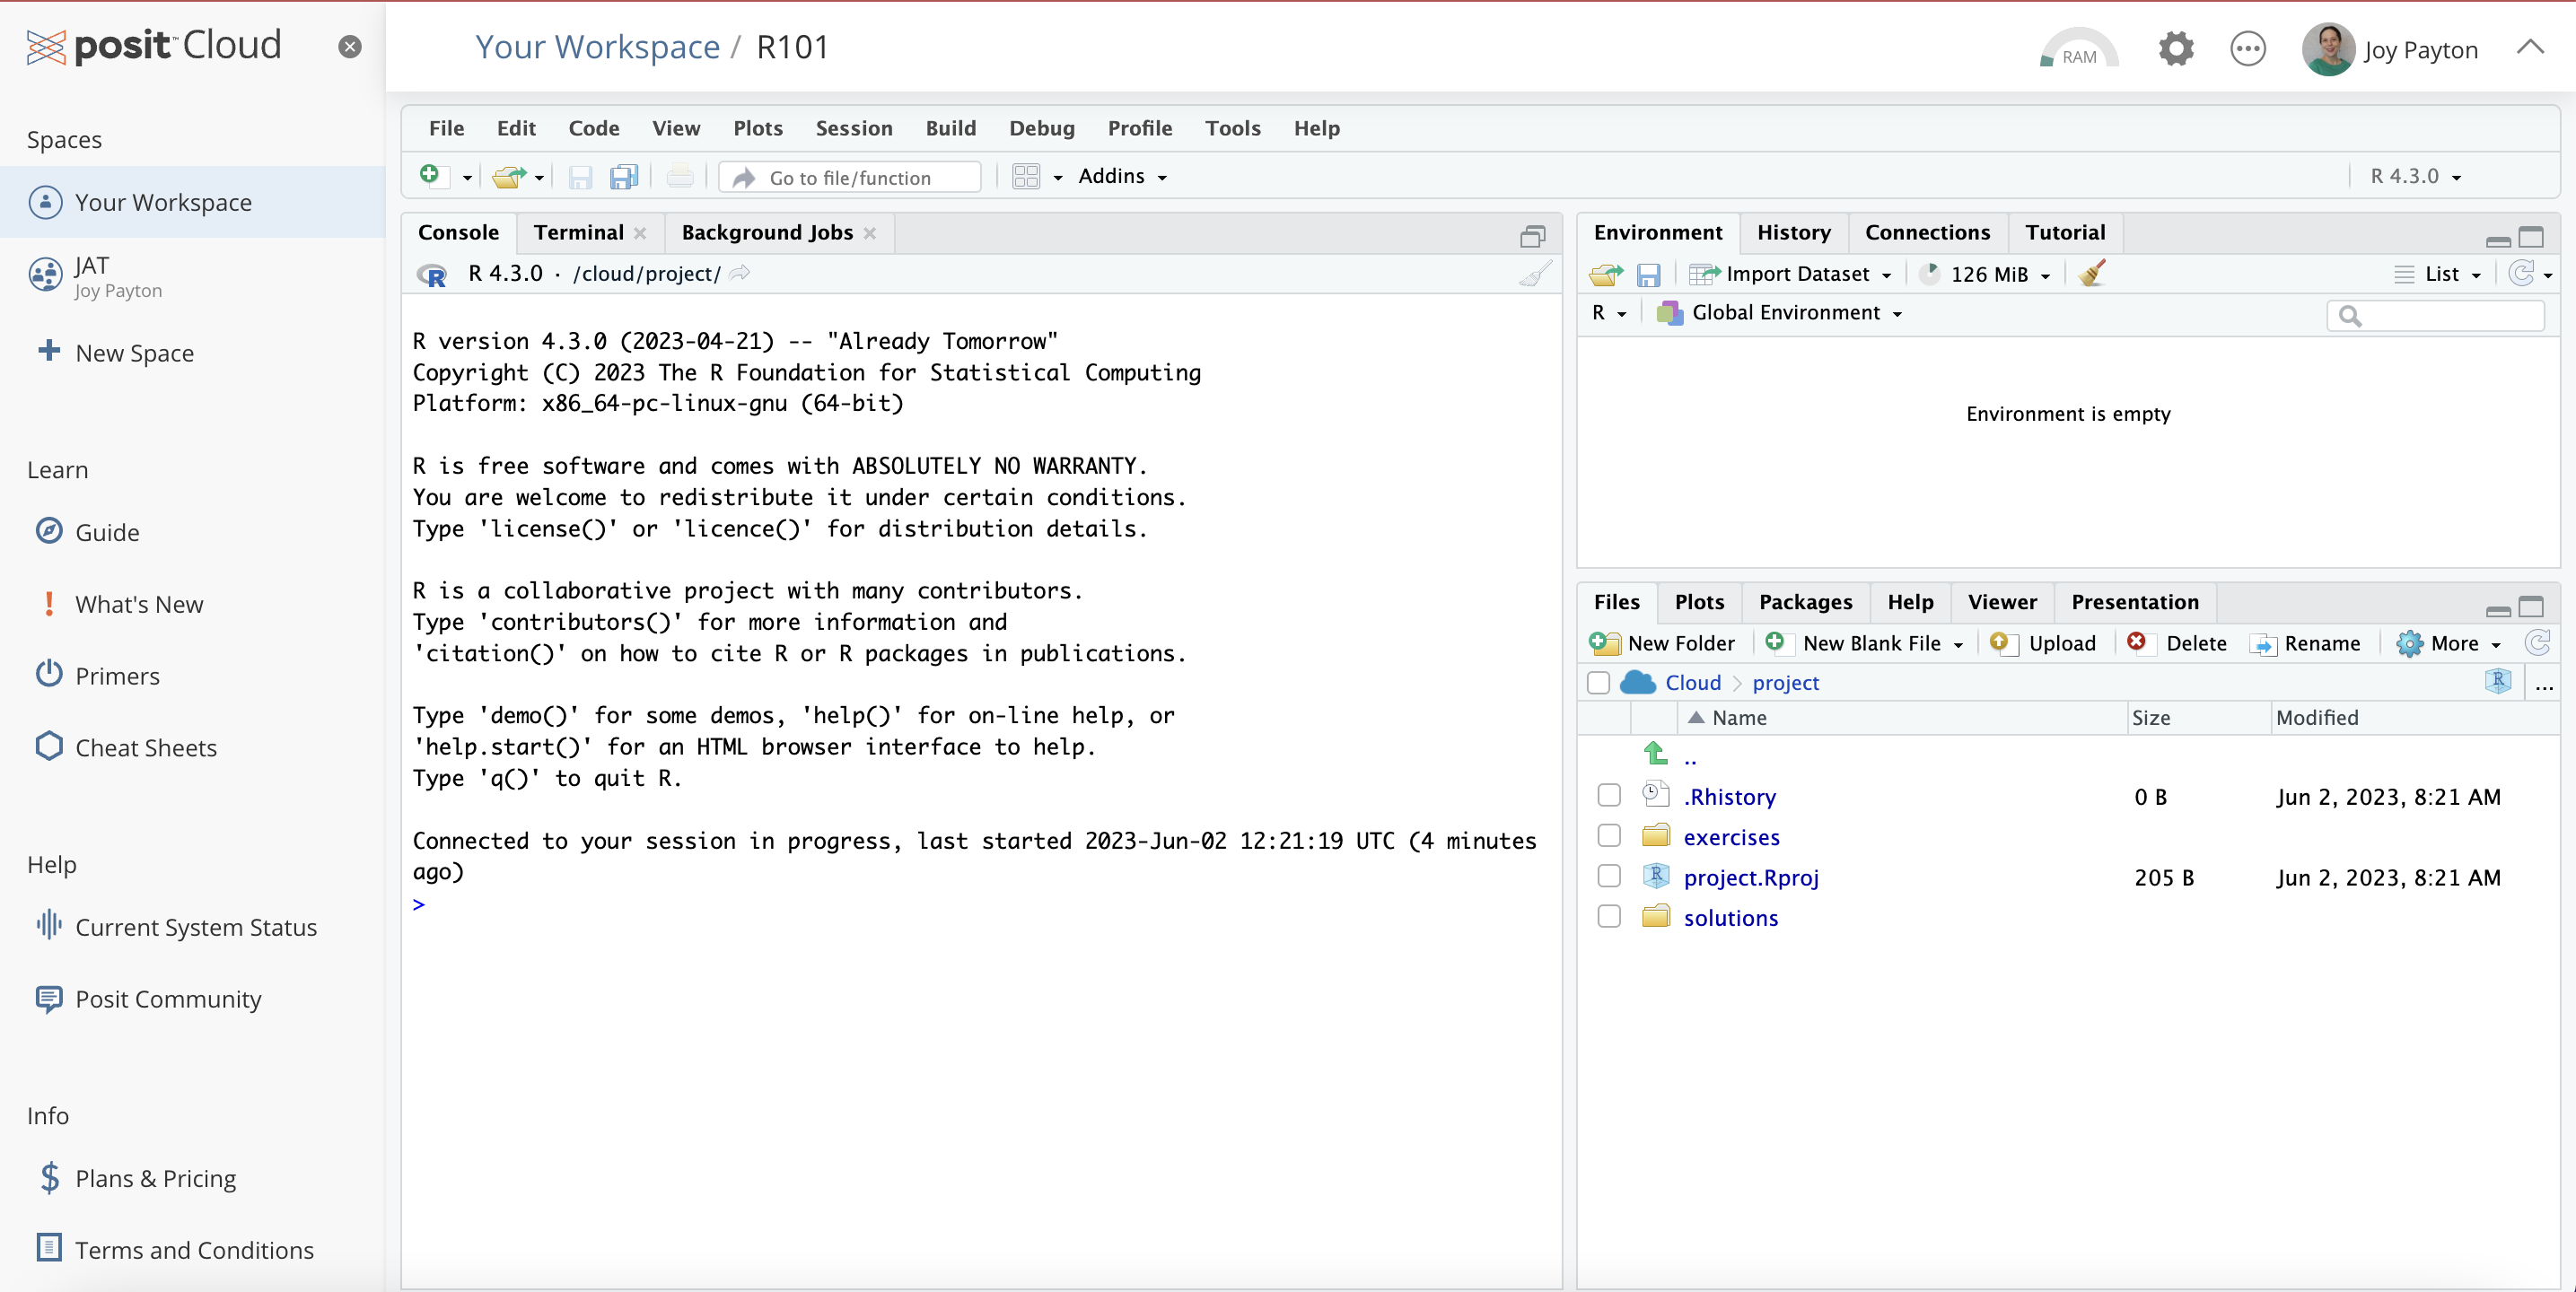
Please click on “Save a Permanent Copy”. If you don’t do this, you could “fill up” our seats on the shared copy, and prevent other people from participating!
Click “thumbs up” once you see something like the image below.
The Duke Cancer Scandal
- Chemo sensitivity from microarrays
- Serious errors in data analysis
- Clinical trials based on flawed models
- Papers retracted, lawsuits settled

Point-and-Click…
… is not reproducible!
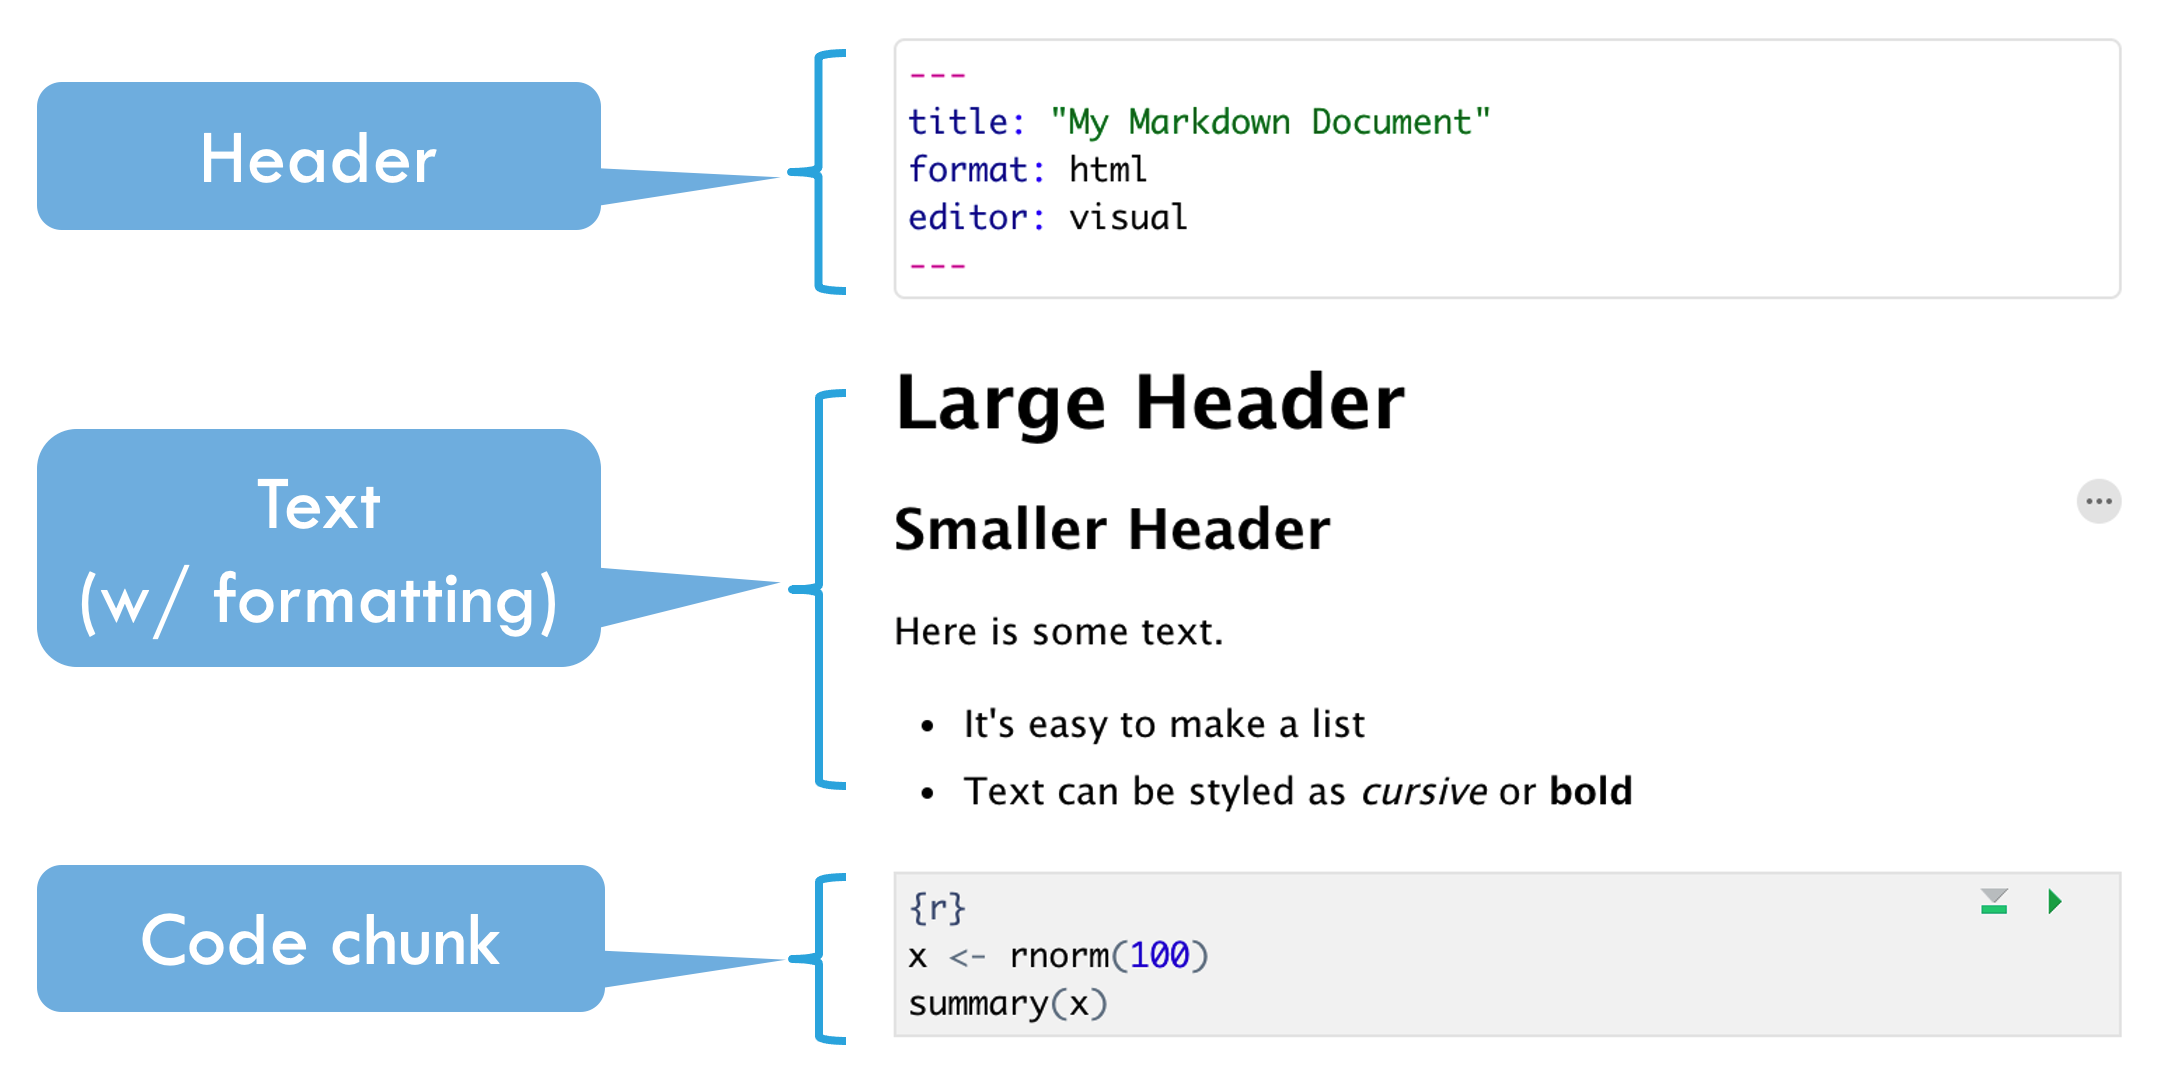
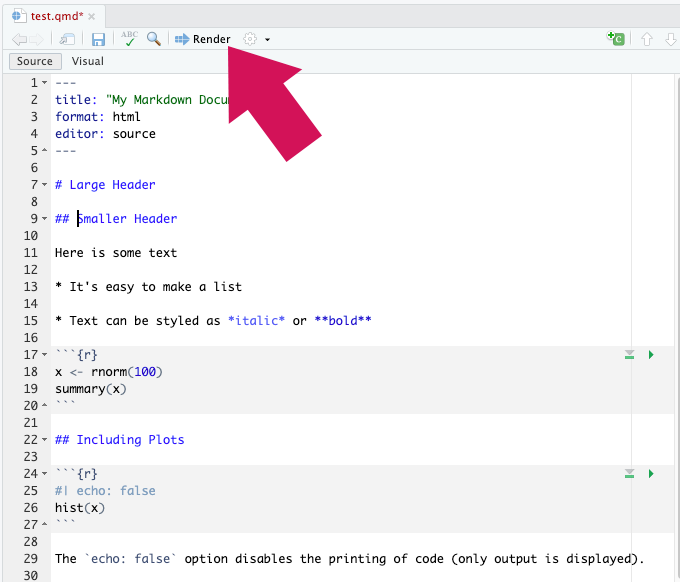
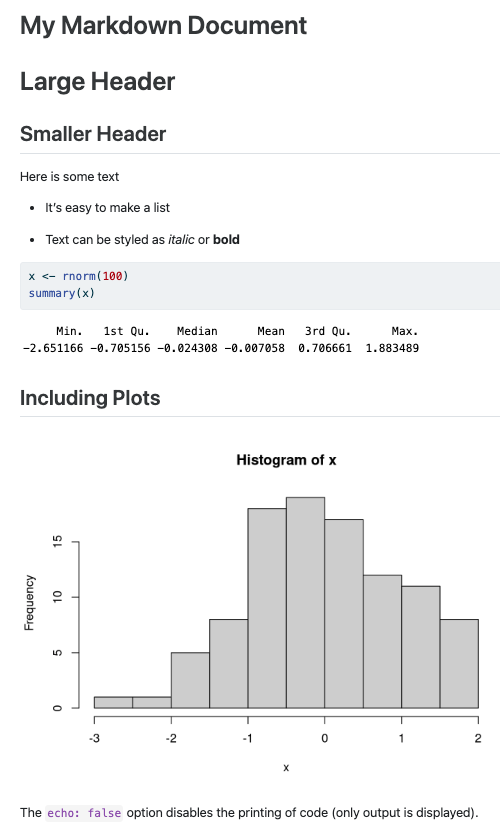
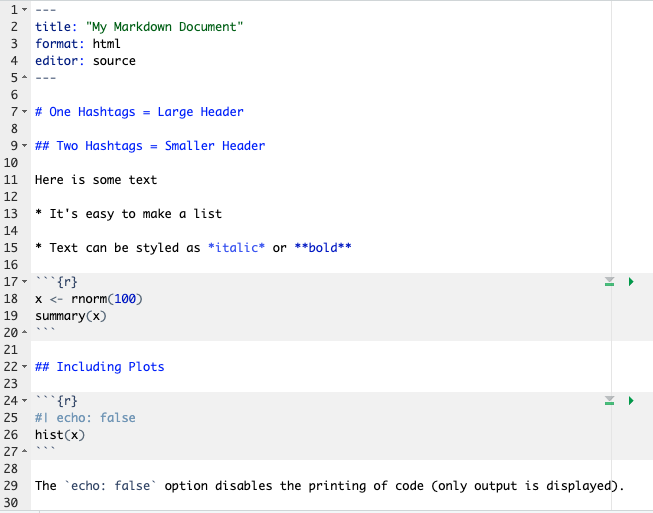
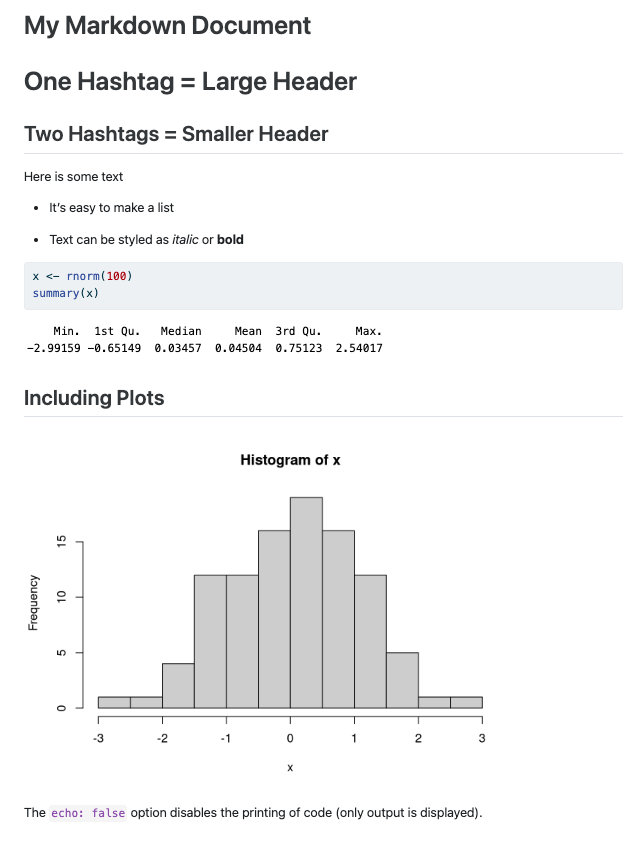
Anatomy of a Quarto Document
Running a Single Code Chunk
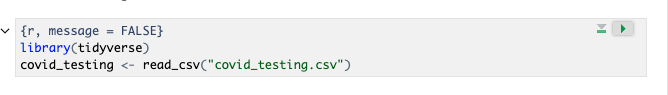
Can you see the green “play” button?
That’s how you run this chunk!
Rendering
You will see (“Knit”/“Preview” instead of “Render” in R Markdown documents)
Your Turn #2
Go to File > New File > Quarto Document. Click OK.
This will give you a handy template which is used to show you a working example of a simple R Markdown document. You will be asked to provide a title and author, and you can choose any values you like, such as “Test” or “My First Markdown”.
Run each chunk by clicking the green “play” button ( ). Note what happens.
Render the document ( ). Type “test” and click Save to save the HTML file. Inspect the HTML document.
03:00
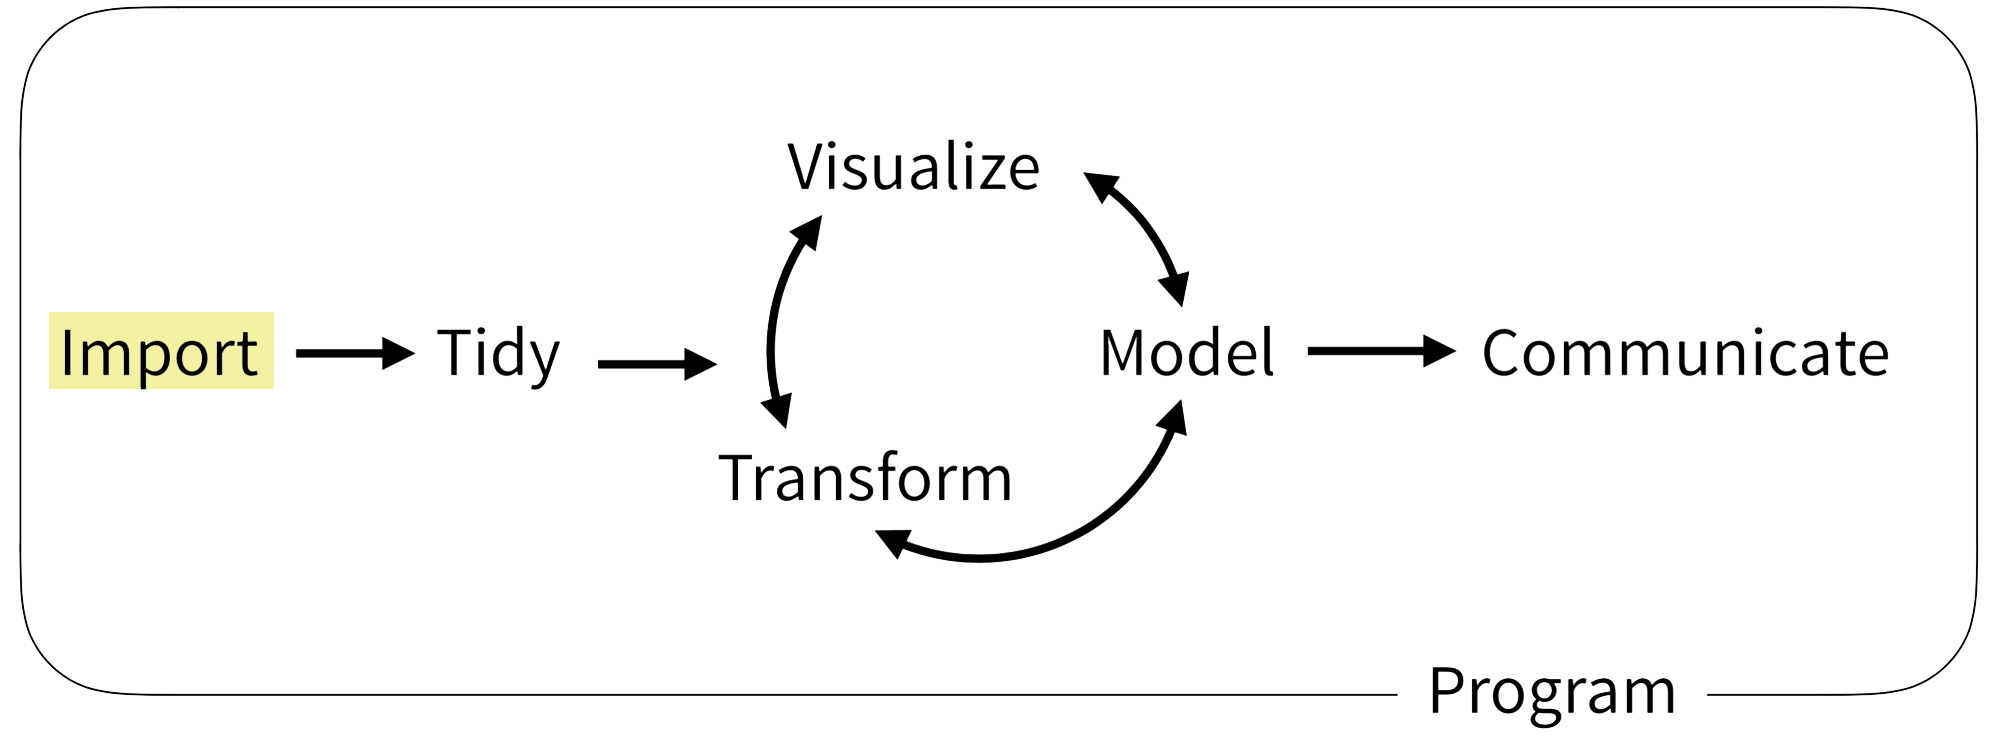
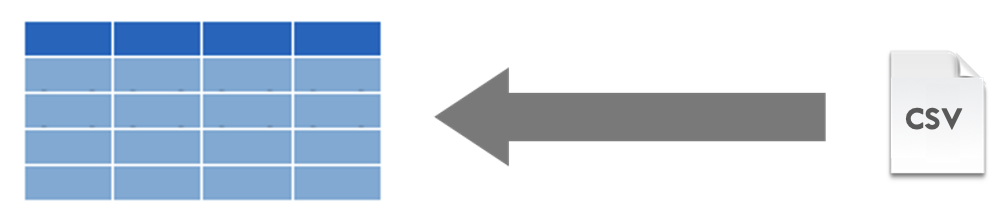
The Data Analysis Pipeline
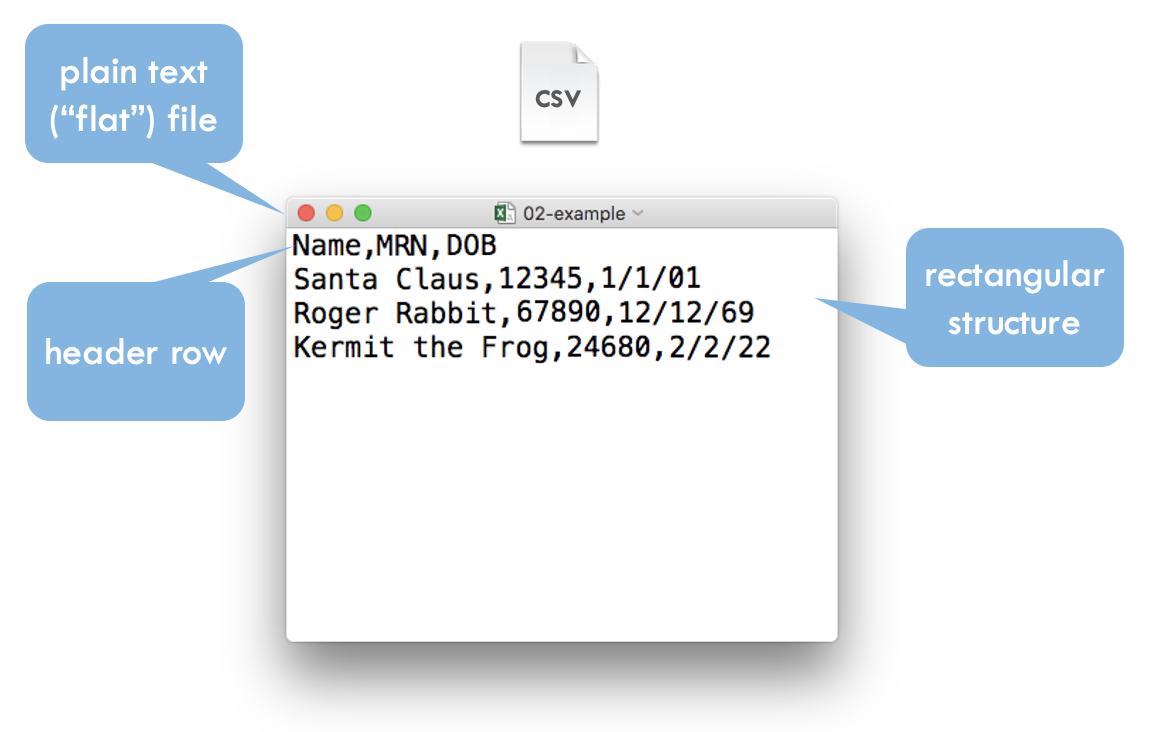
CSV
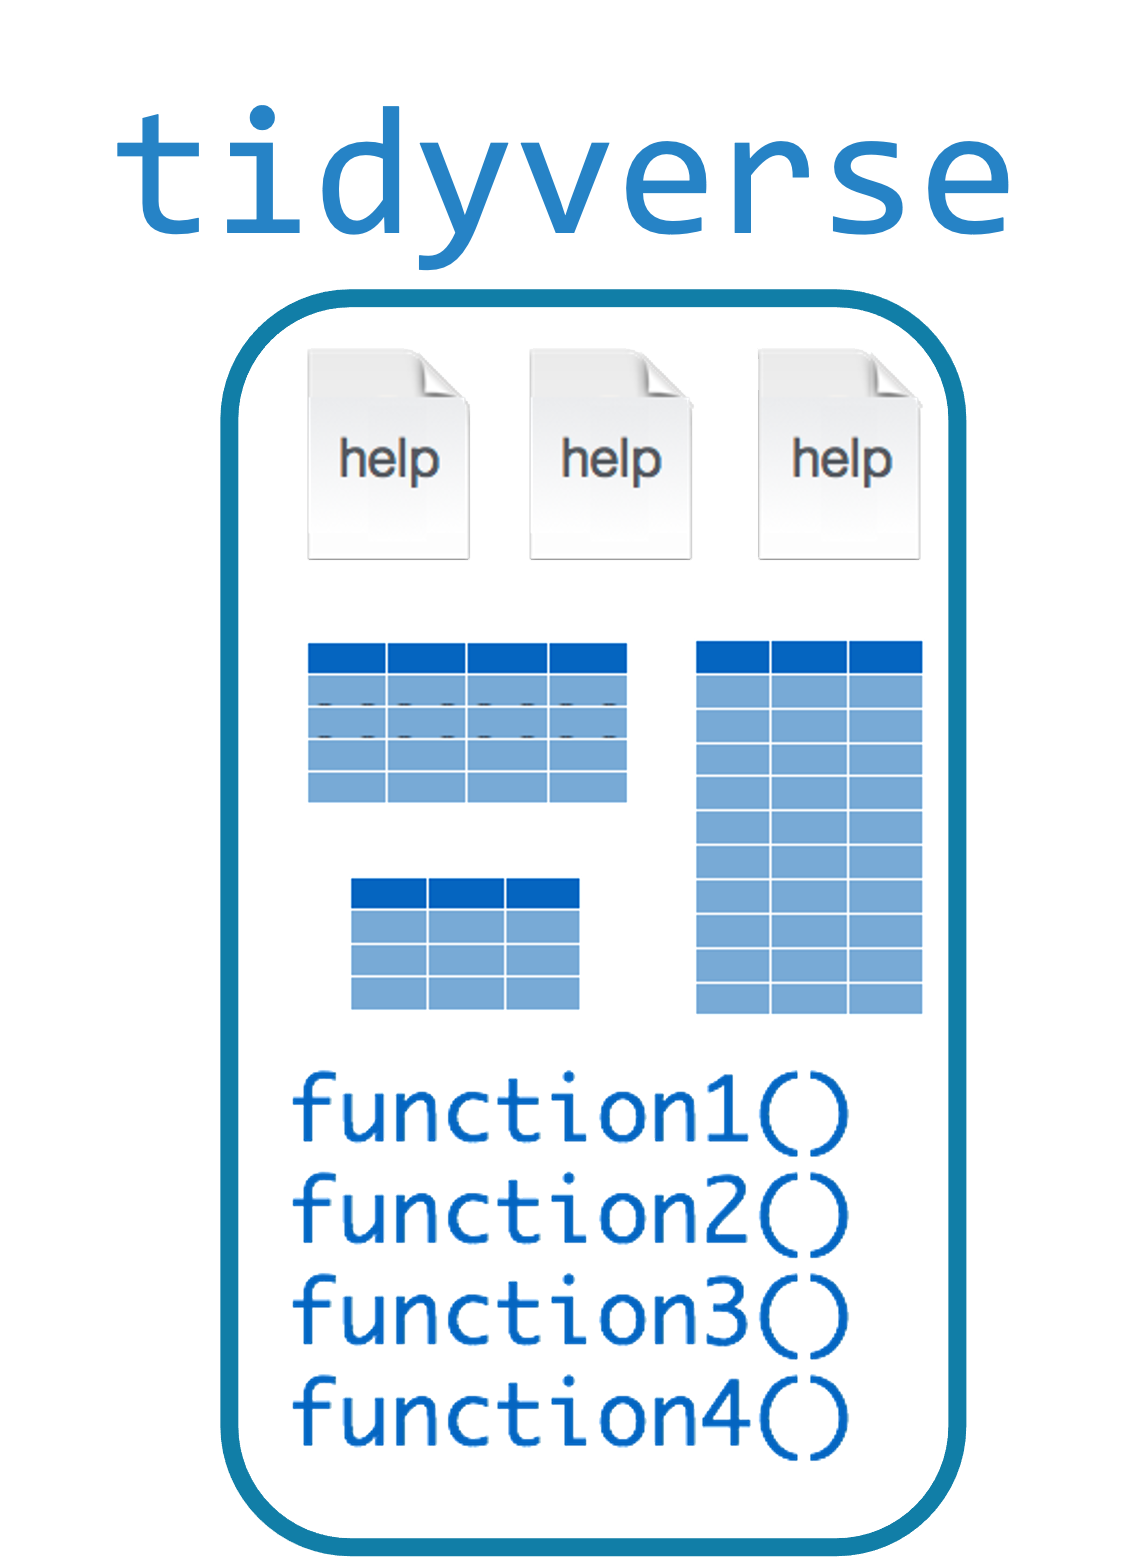
Tidyverse
- A consistent way to organize data
- Human readable, concise, consistent code
- Build pipelines from atomic data analysis steps
![]()
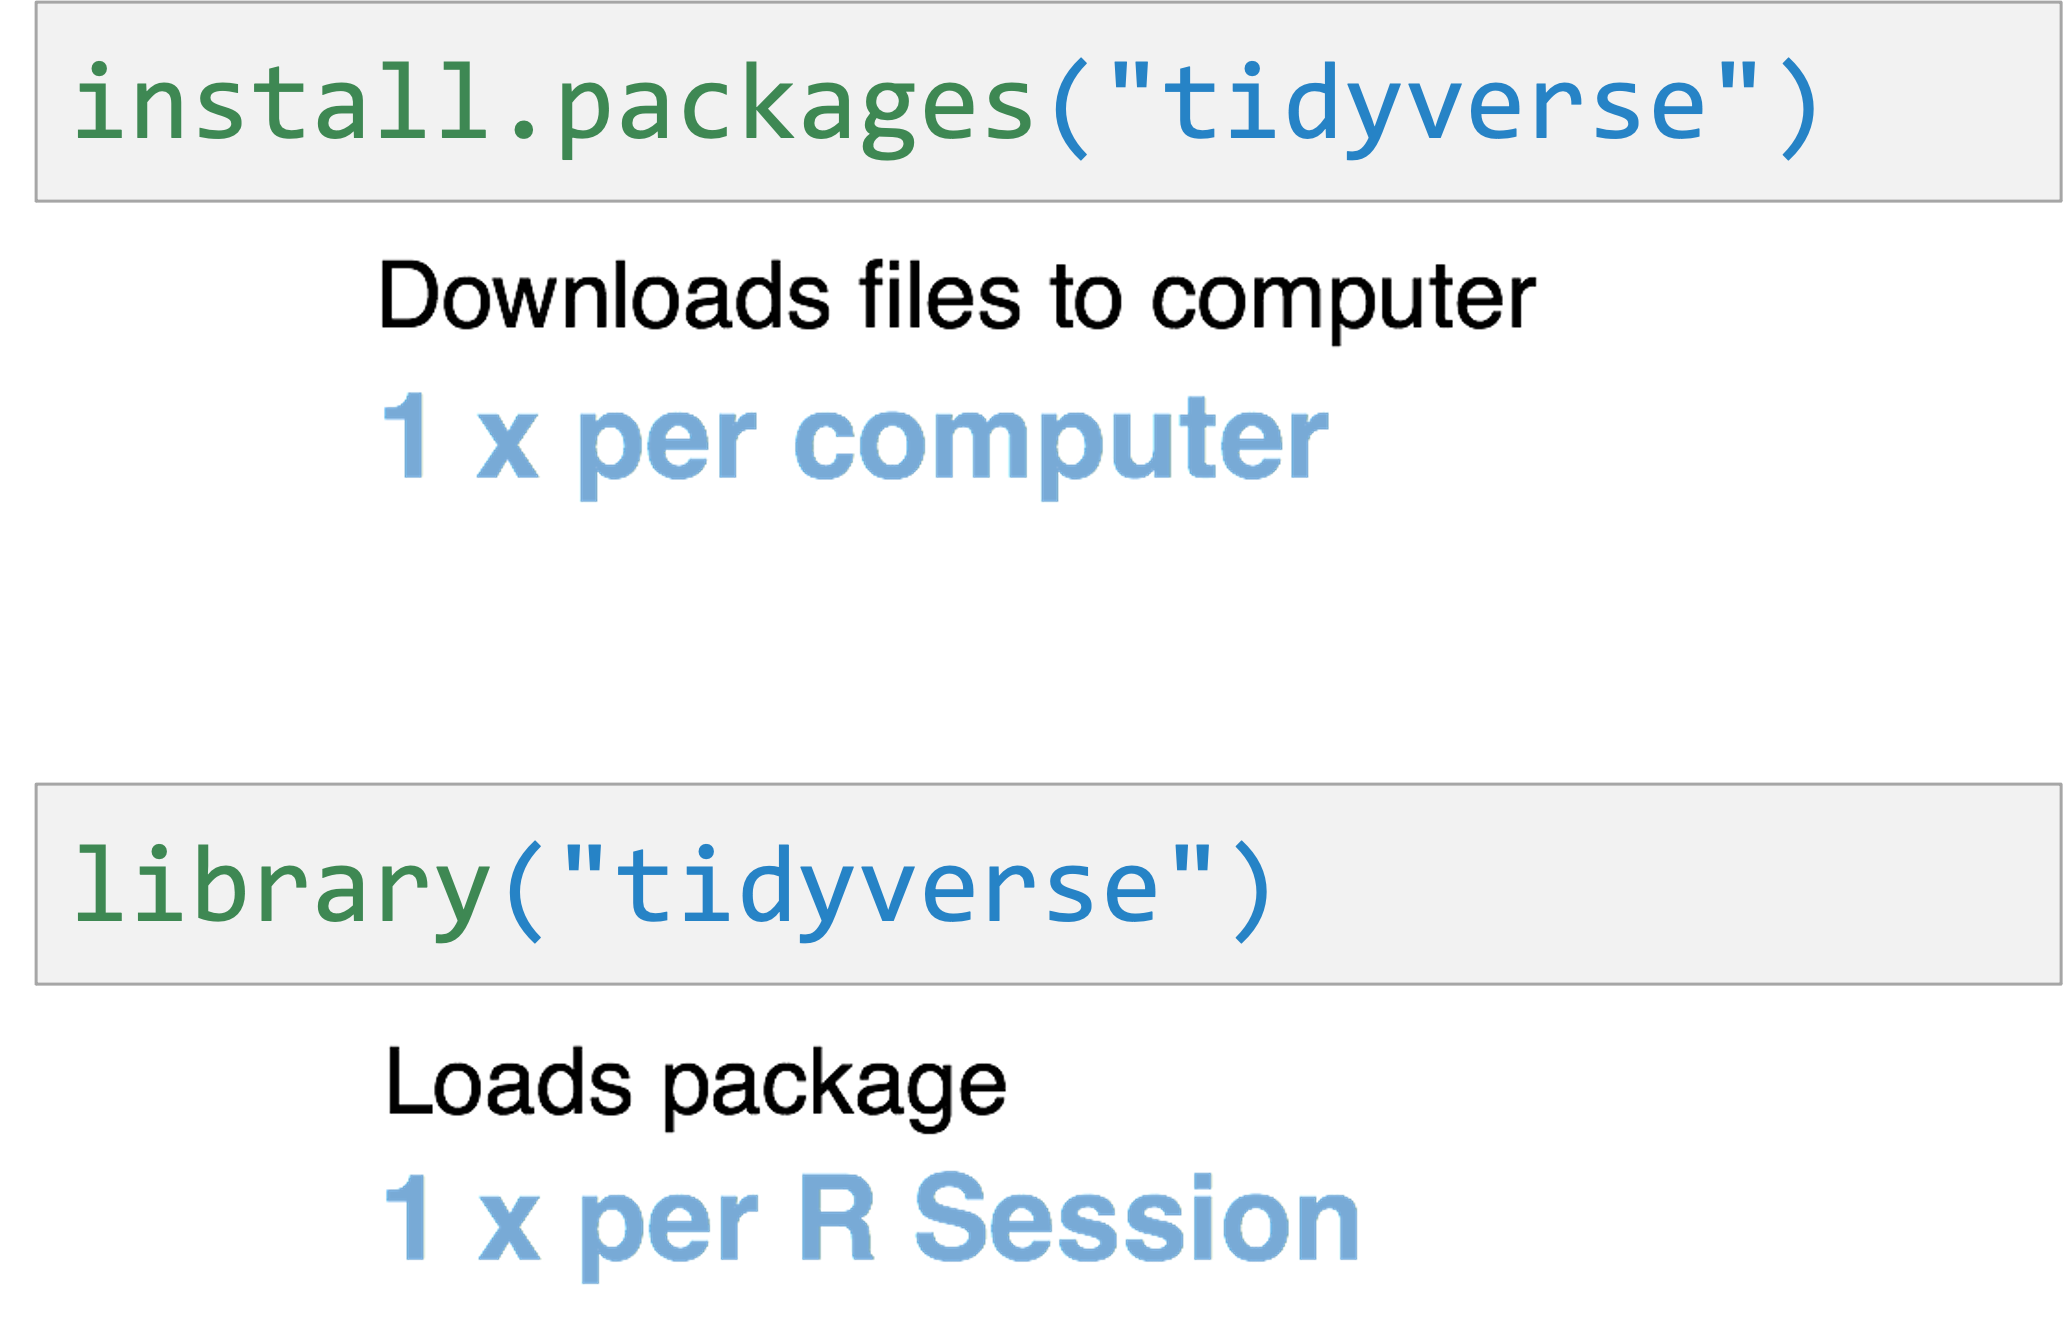
Installing and Loading Packages
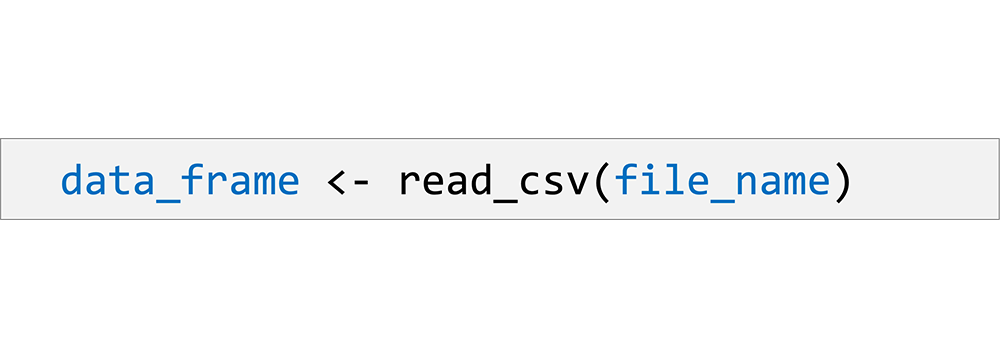
read_csv()
Functions
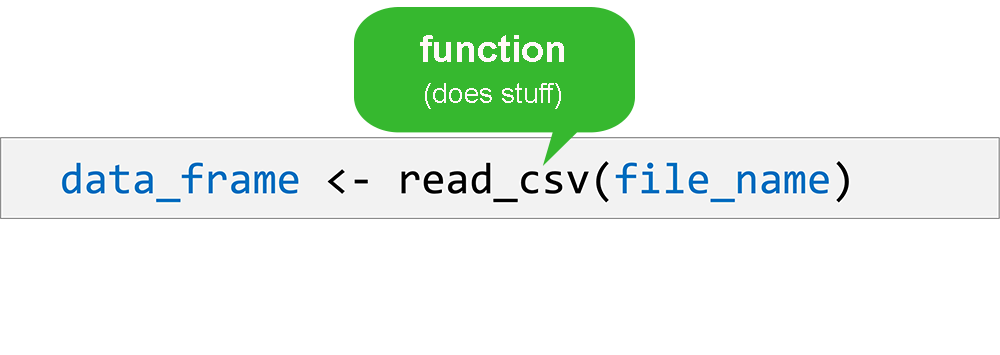
Functions
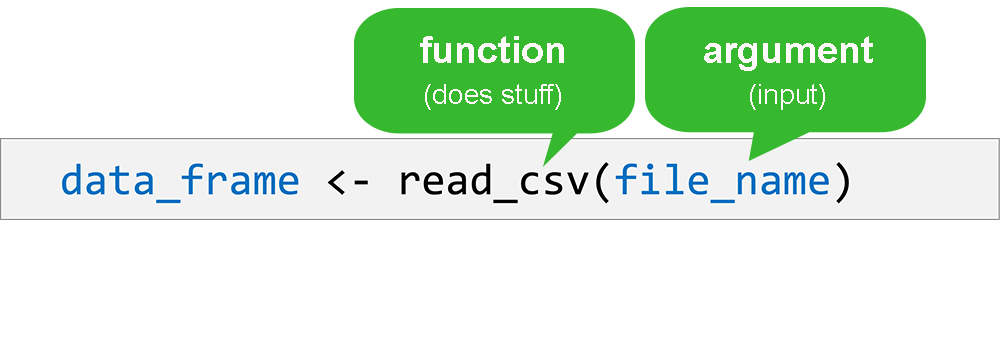
Functions
Functions
read_csv()
Recap
![]()
Programming Language
![]()
IDE (Editor)
Document Format
Packages extend the functionality of R. Install with install.packages() and load with library()
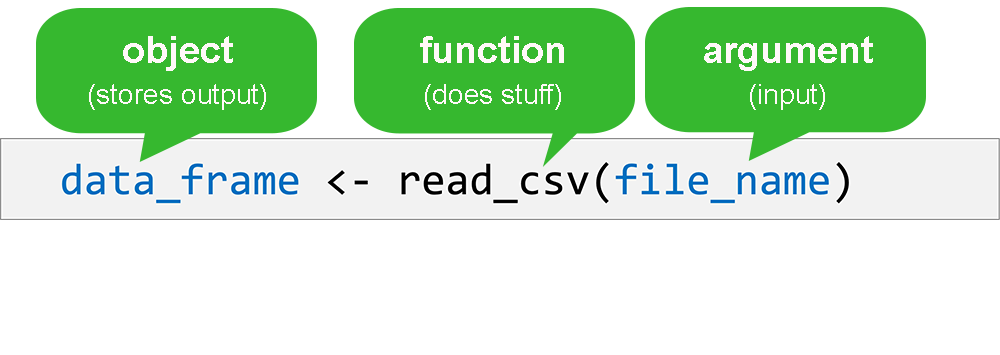
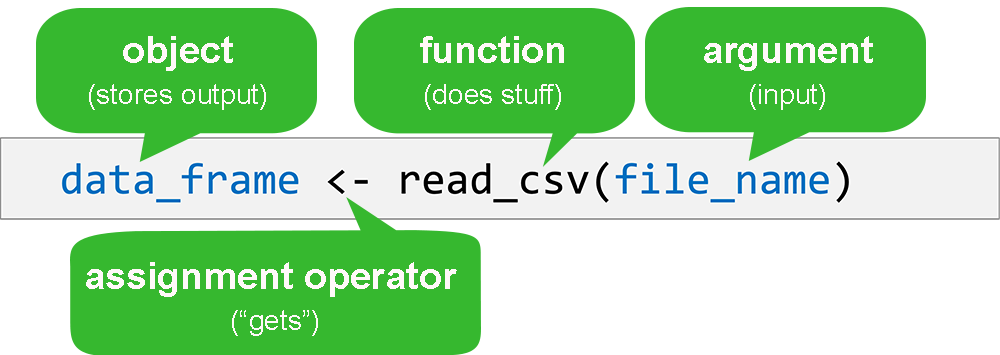
Functions do stuff. They accept Arguments as input and return an Output. Capture an output in an Object using the assignment operator ( <- ).
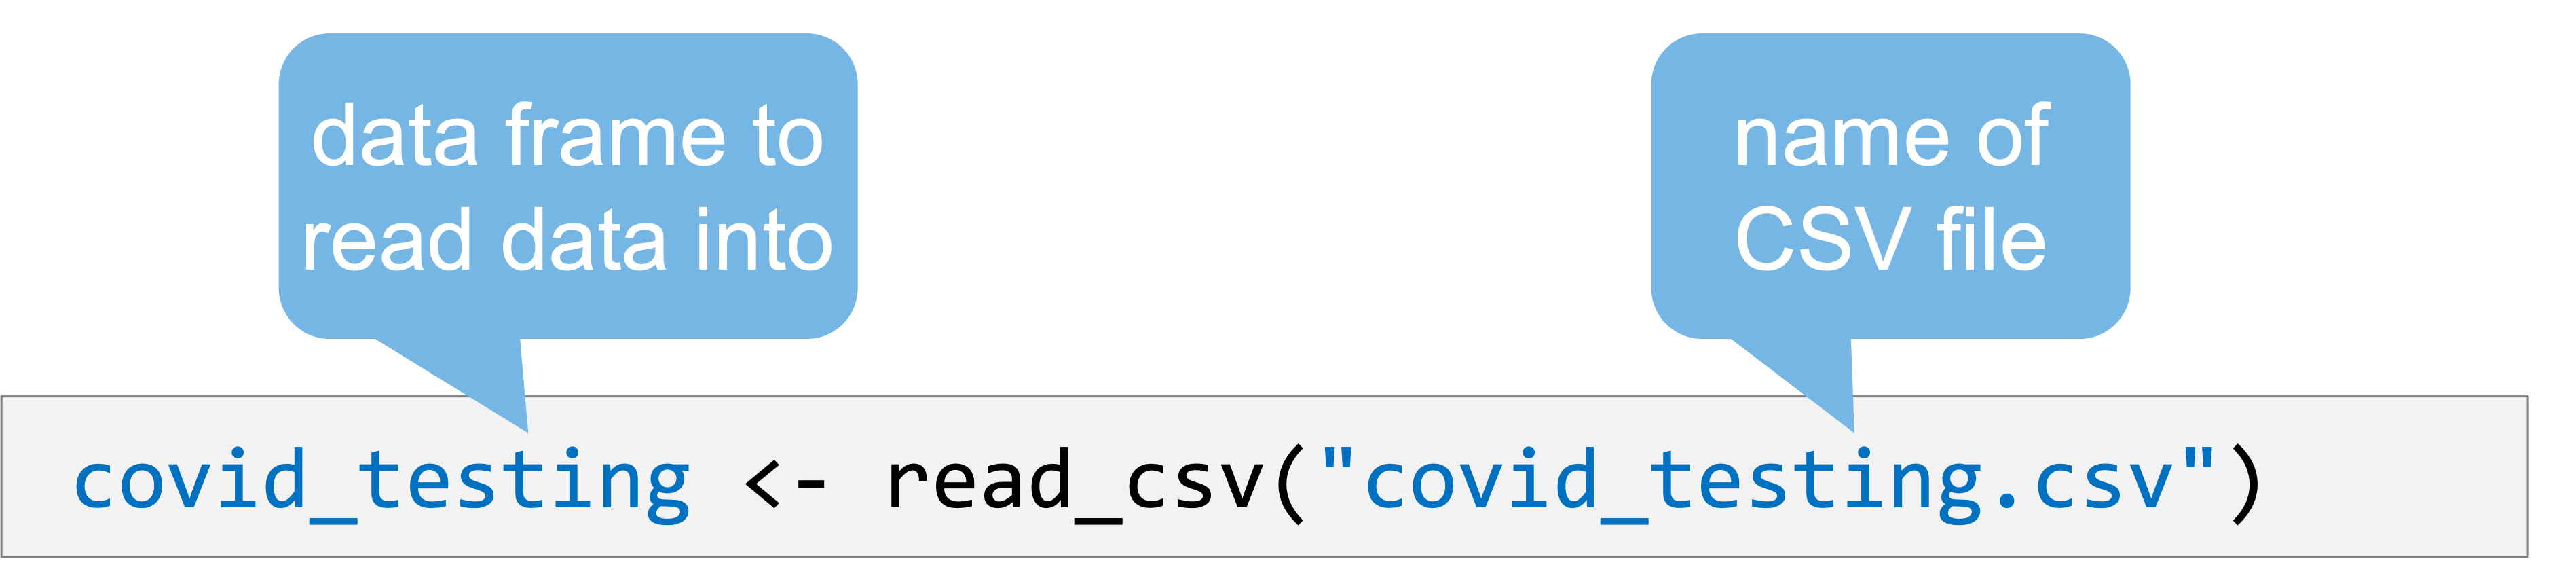
Importing Data is the first step of data analysis. Use read_csv() from the tidyverse package to import data stored in a CSV file.
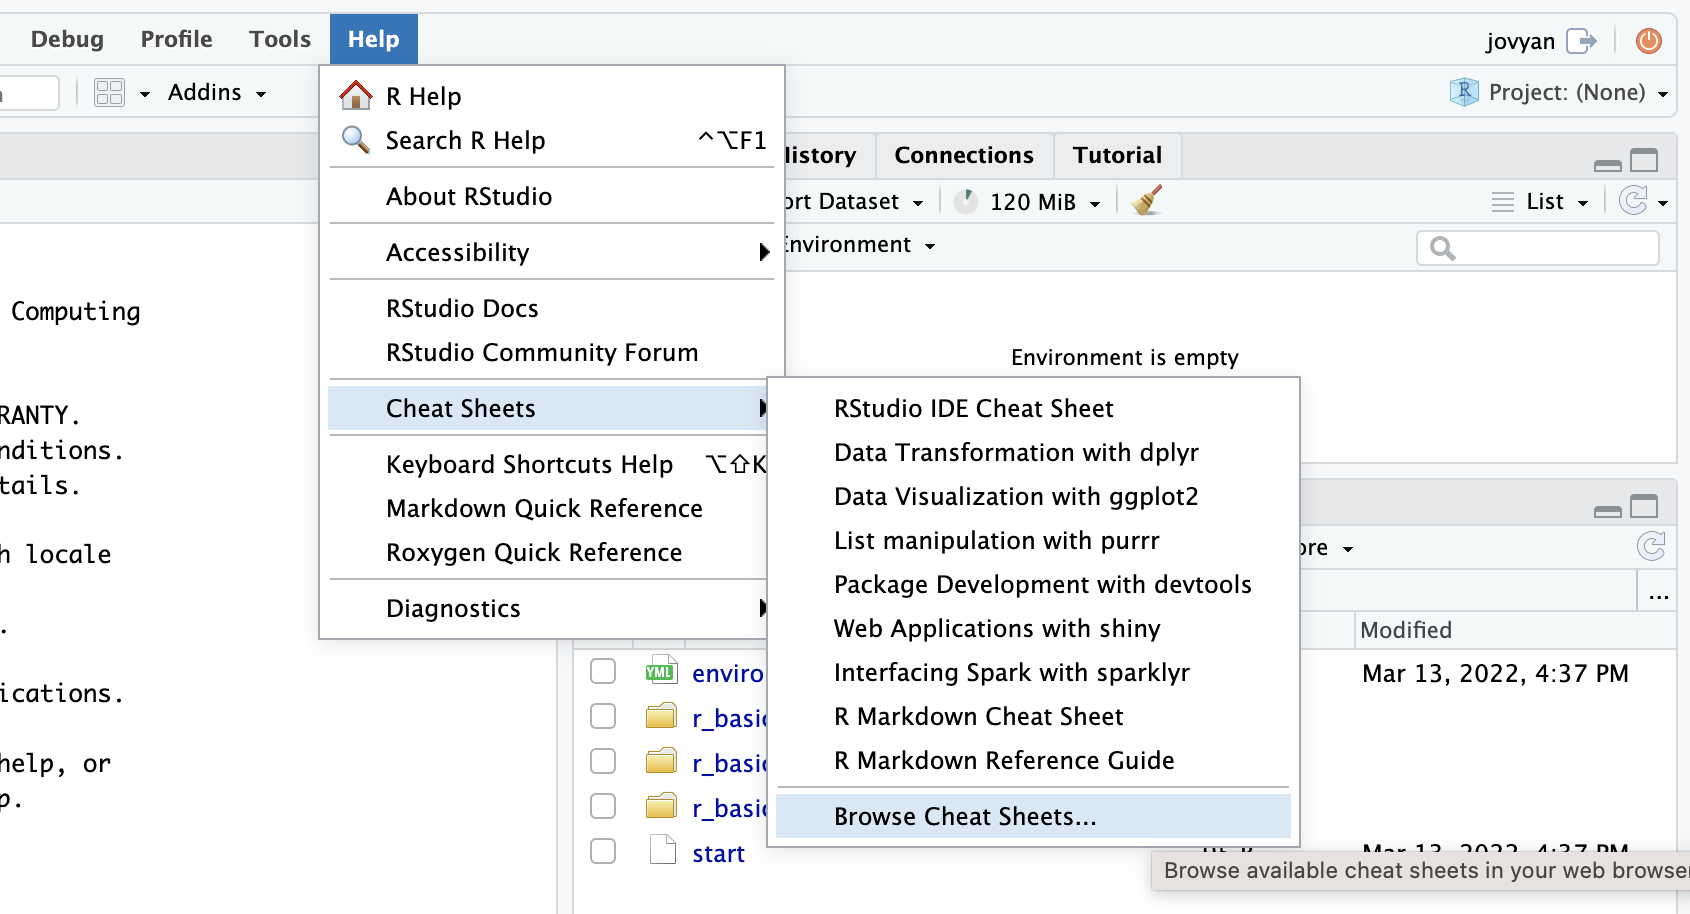
Cheat Sheets
R for Data Science
In English:
- 2nd edition: https://r4ds.hadley.nz/
- 1st edition: https://r4ds.had.co.nz
English unofficial solutions (1st ed) at https://jrnold.github.io/r4ds-exercise-solutions/index.html
In Spanish (1st ed): https://es.r4ds.hadley.nz/
File Formats
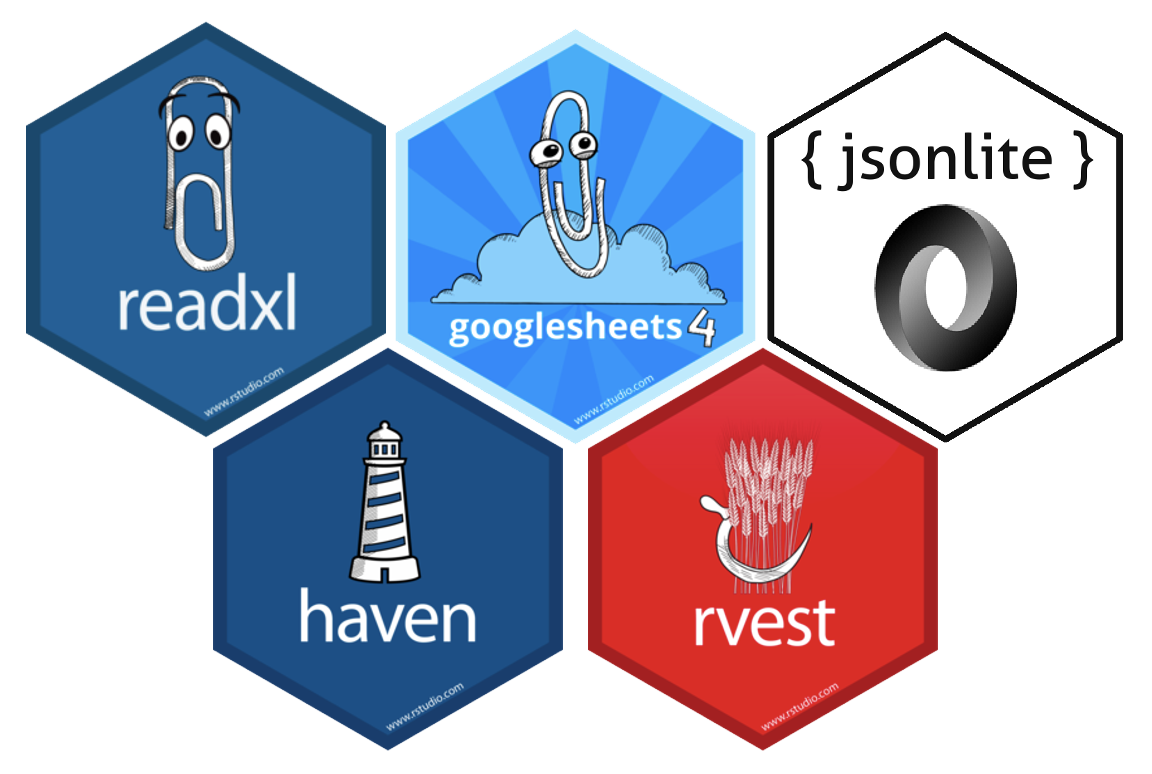
Databases

Other Output Formats

R Interface to Python

```{python}
import pandas
covid_testing.info()
```
Next Up: Visualize
Our next topic is: