![]()
Introduction to R for Clinical Data
Presented by the Children’s Hospital of Philadelphia (CHOP) R User Group and Arcus Data Education
Part I: Introduction
![]()
R Programming language for data analysis
![]()
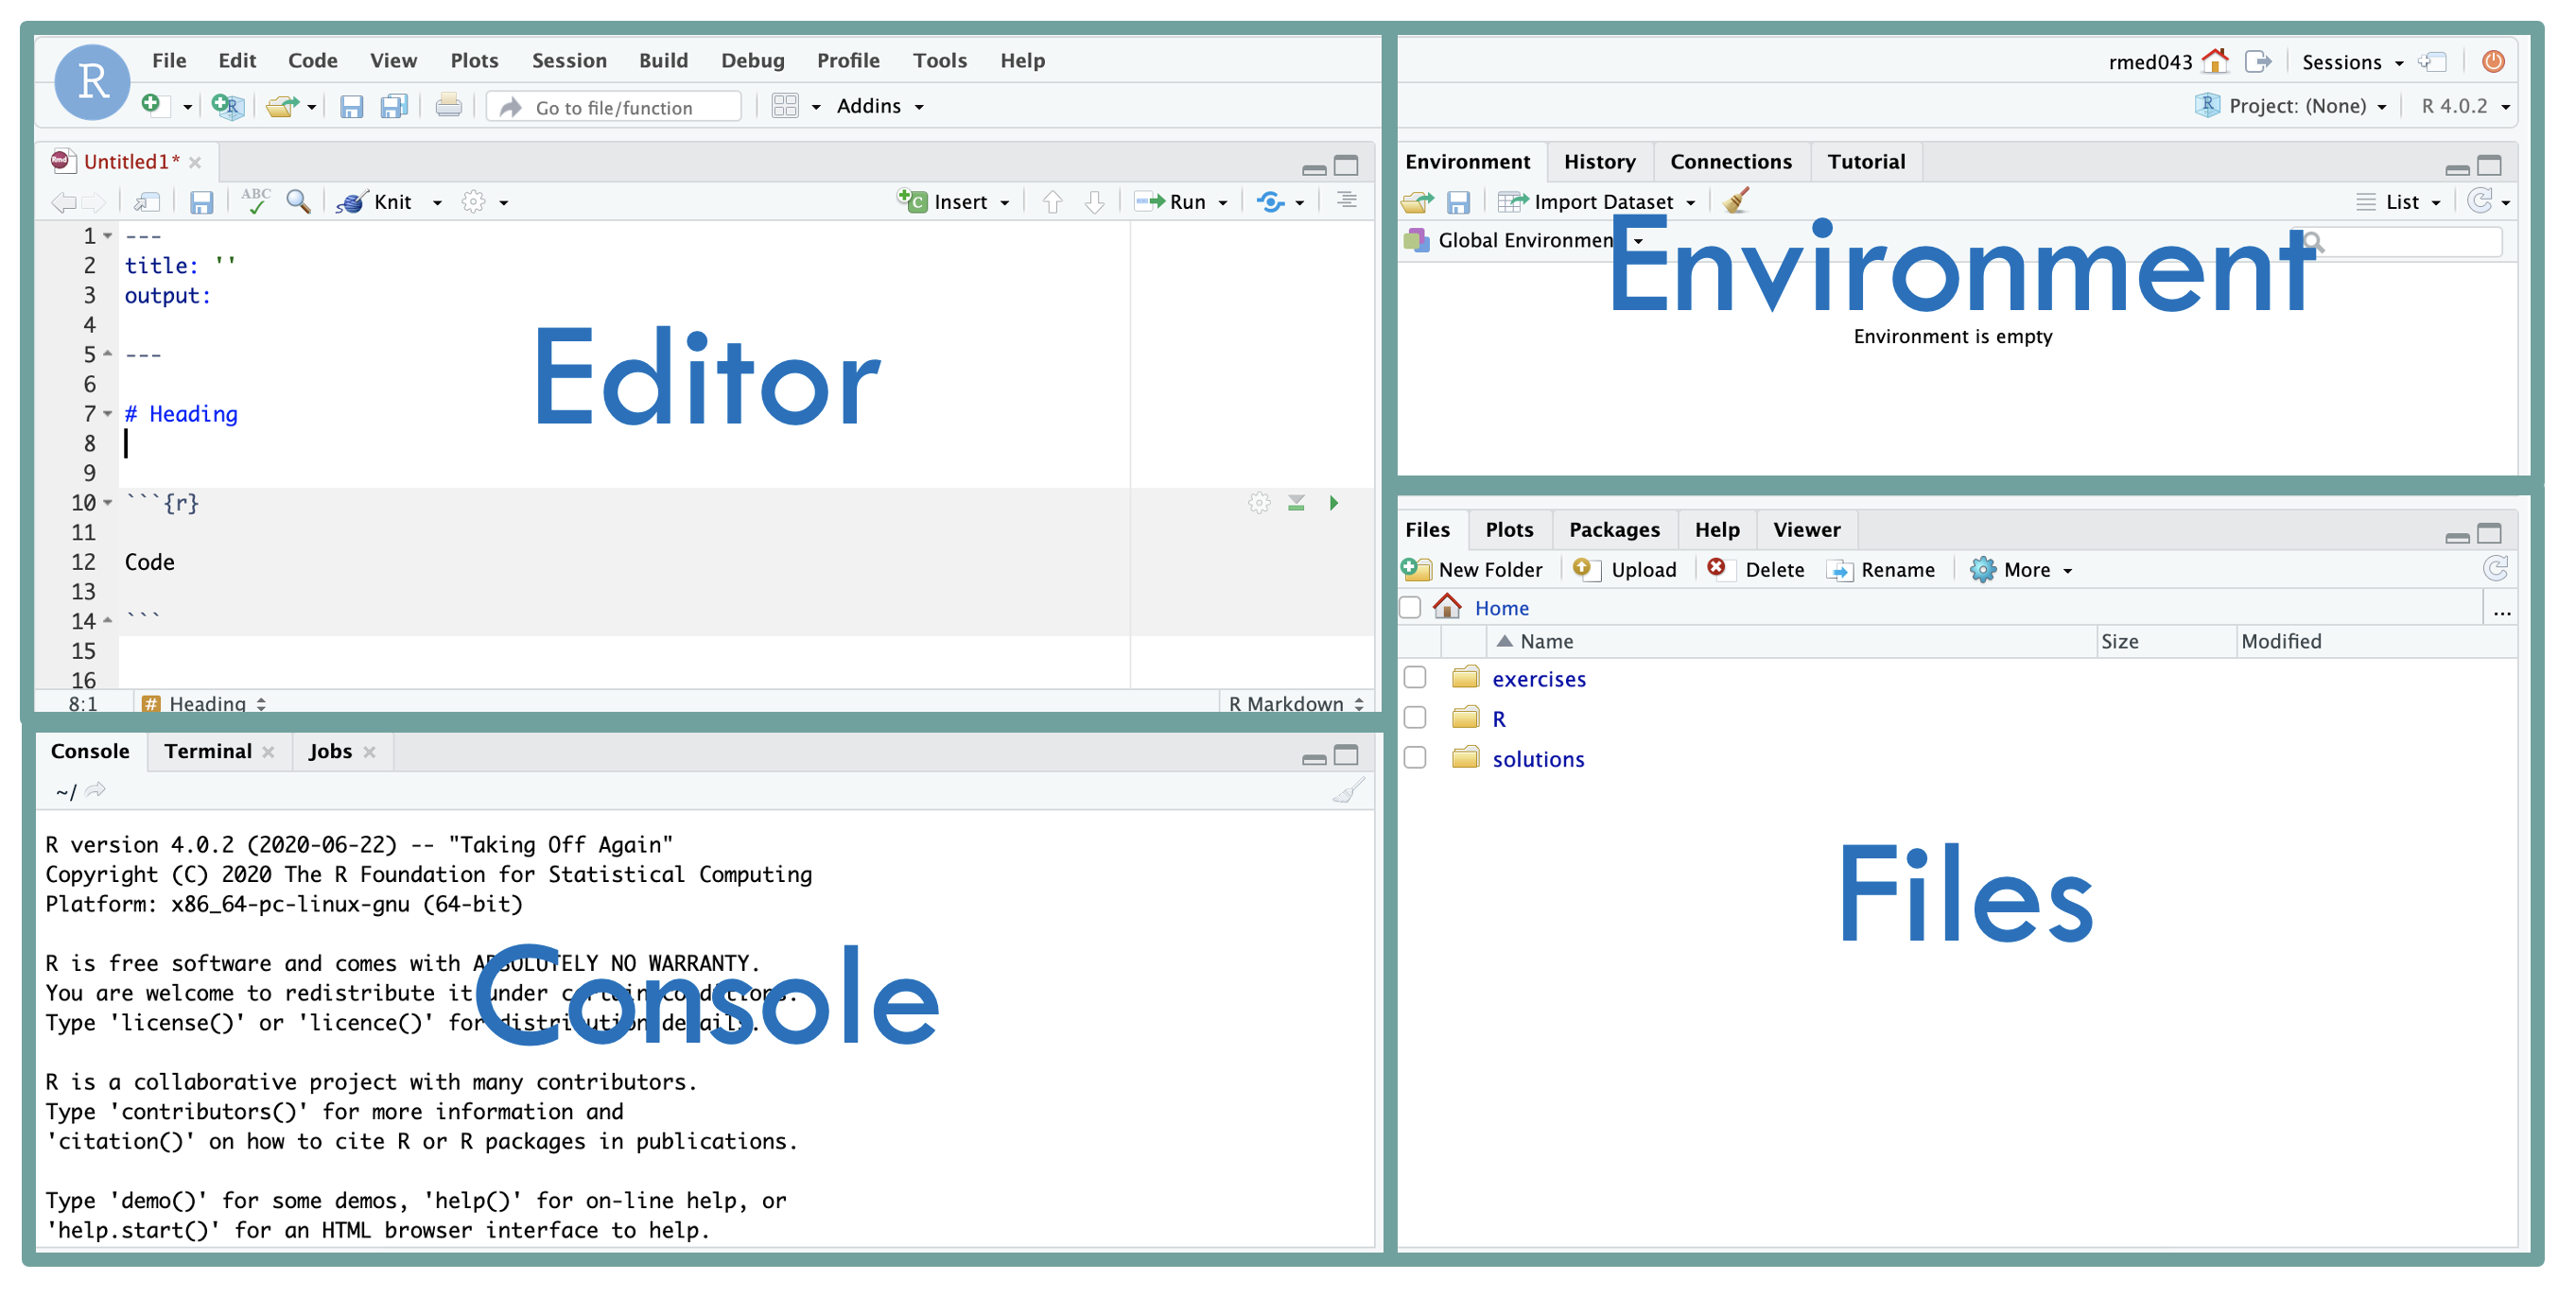
RStudio Integrated development environment (IDE)
![]()
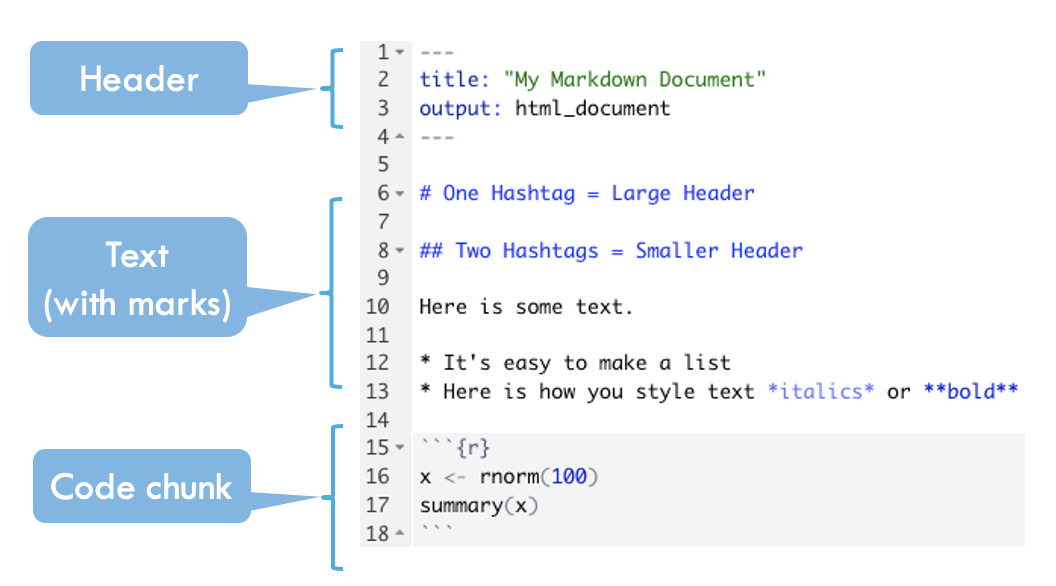
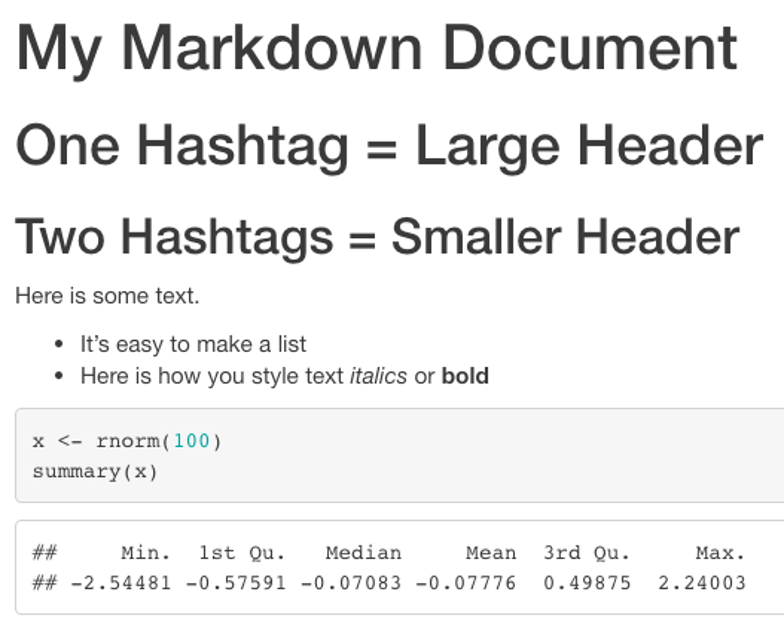
R Markdown Computational document format
RStudio: On the Web and on Your Desktop

RStudio Server
Hosted on a server
(in the cloud)
 RStudio Desktop
Installed on your computer
The Duke Cancer Scandal
- Chemo sensitivity from microarrays
- Serious errors in data analysis
- Clinical trials based on flawed models
- Papers retracted, lawsuits settled

Point-and-Click…
… is not reproducible!
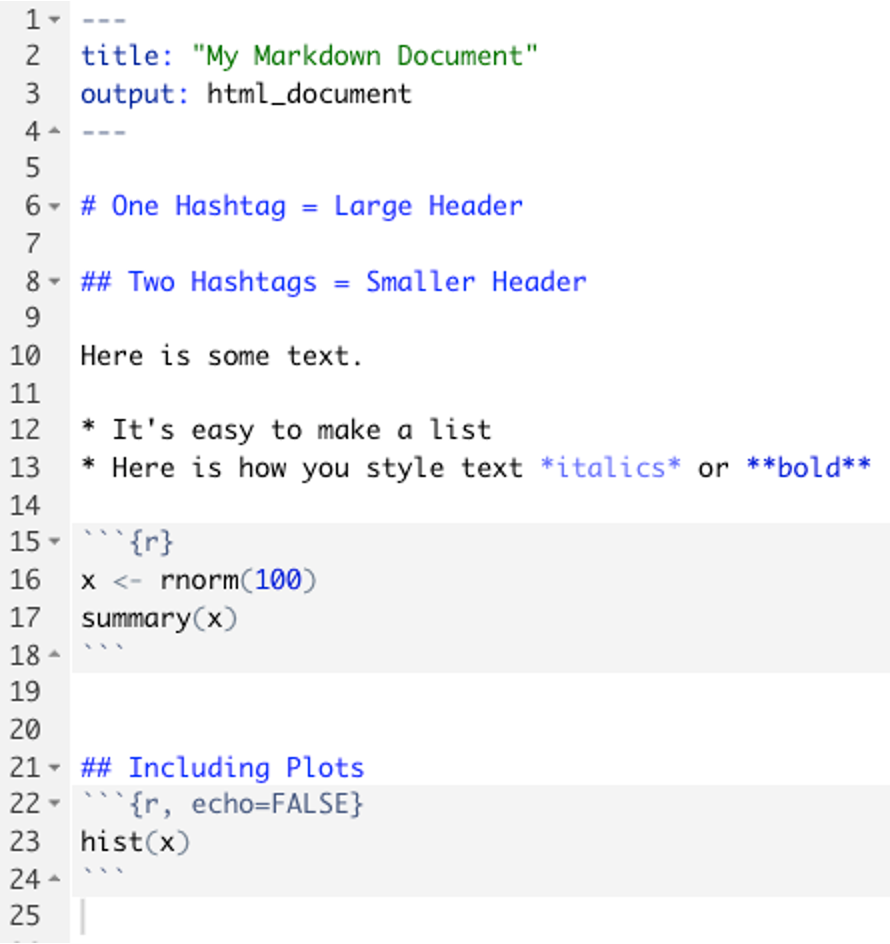
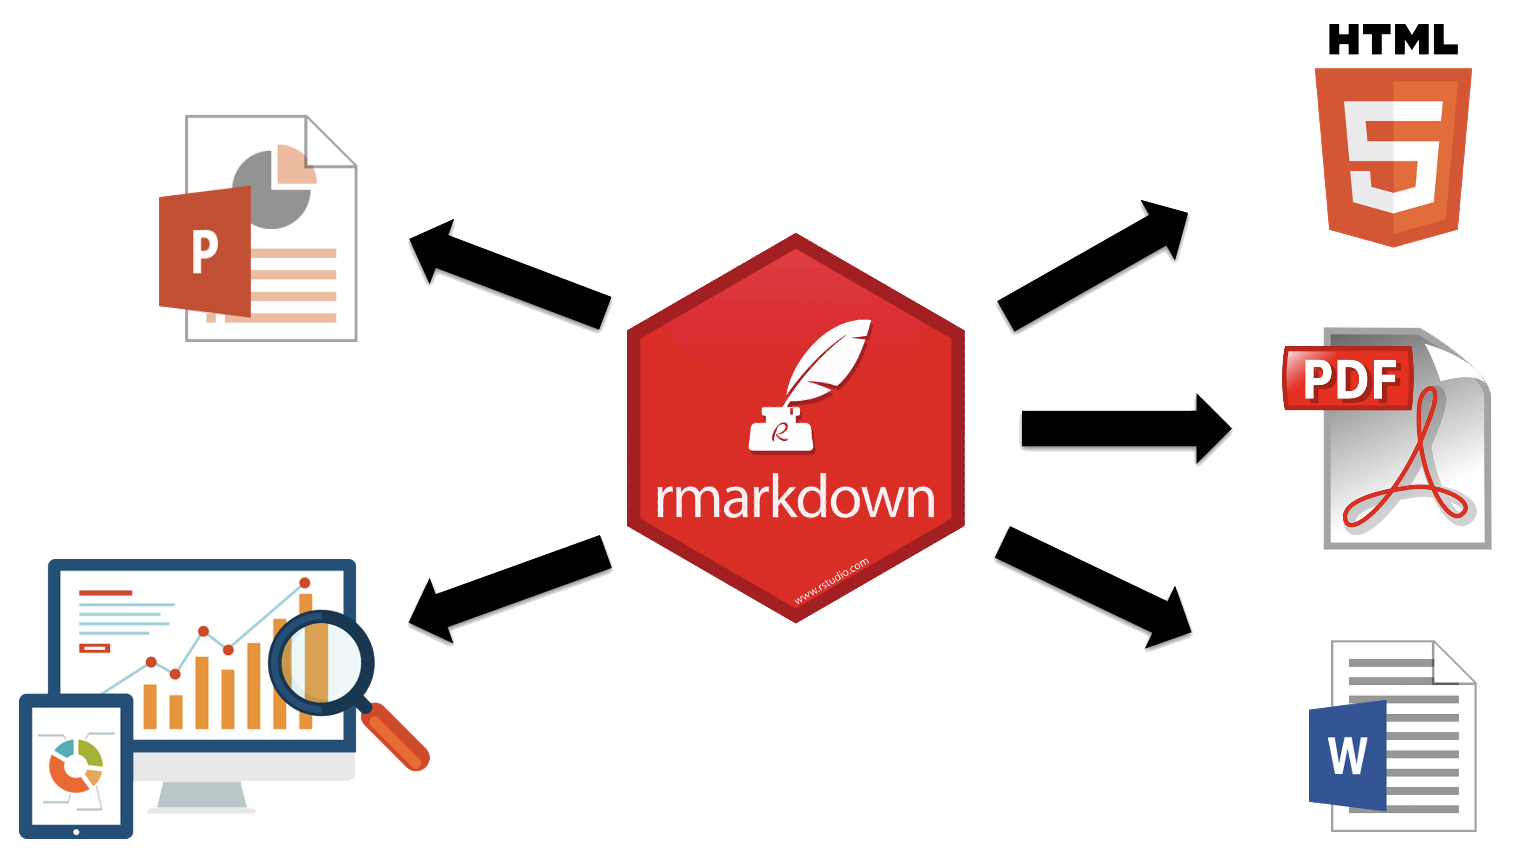
Anatomy of an R Markdown document
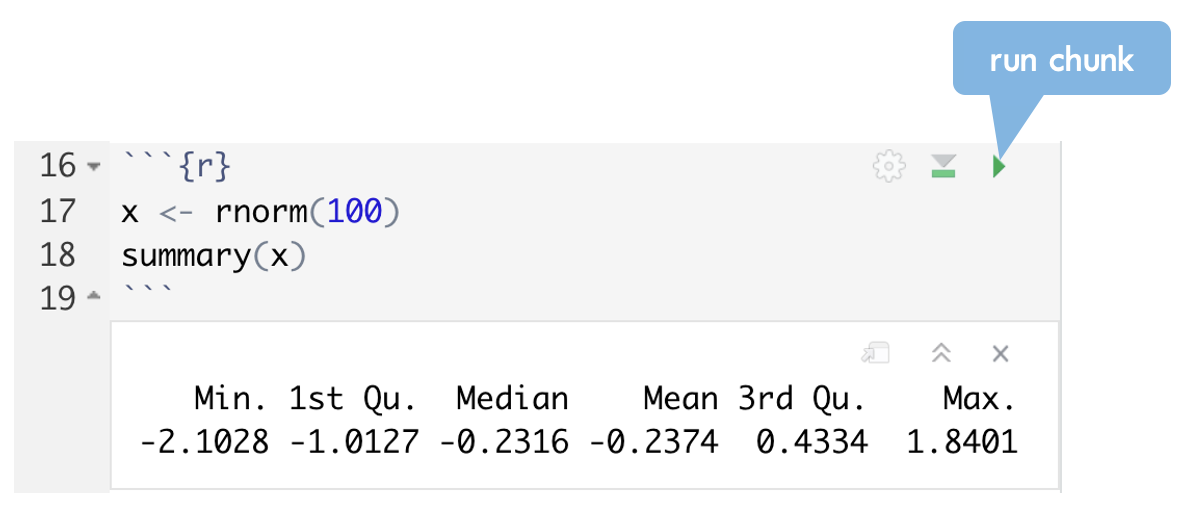
Running a Single Code Chunk
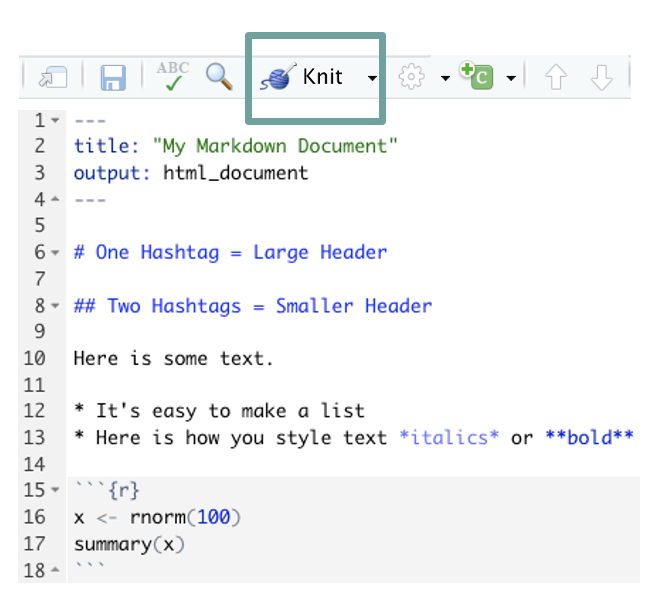
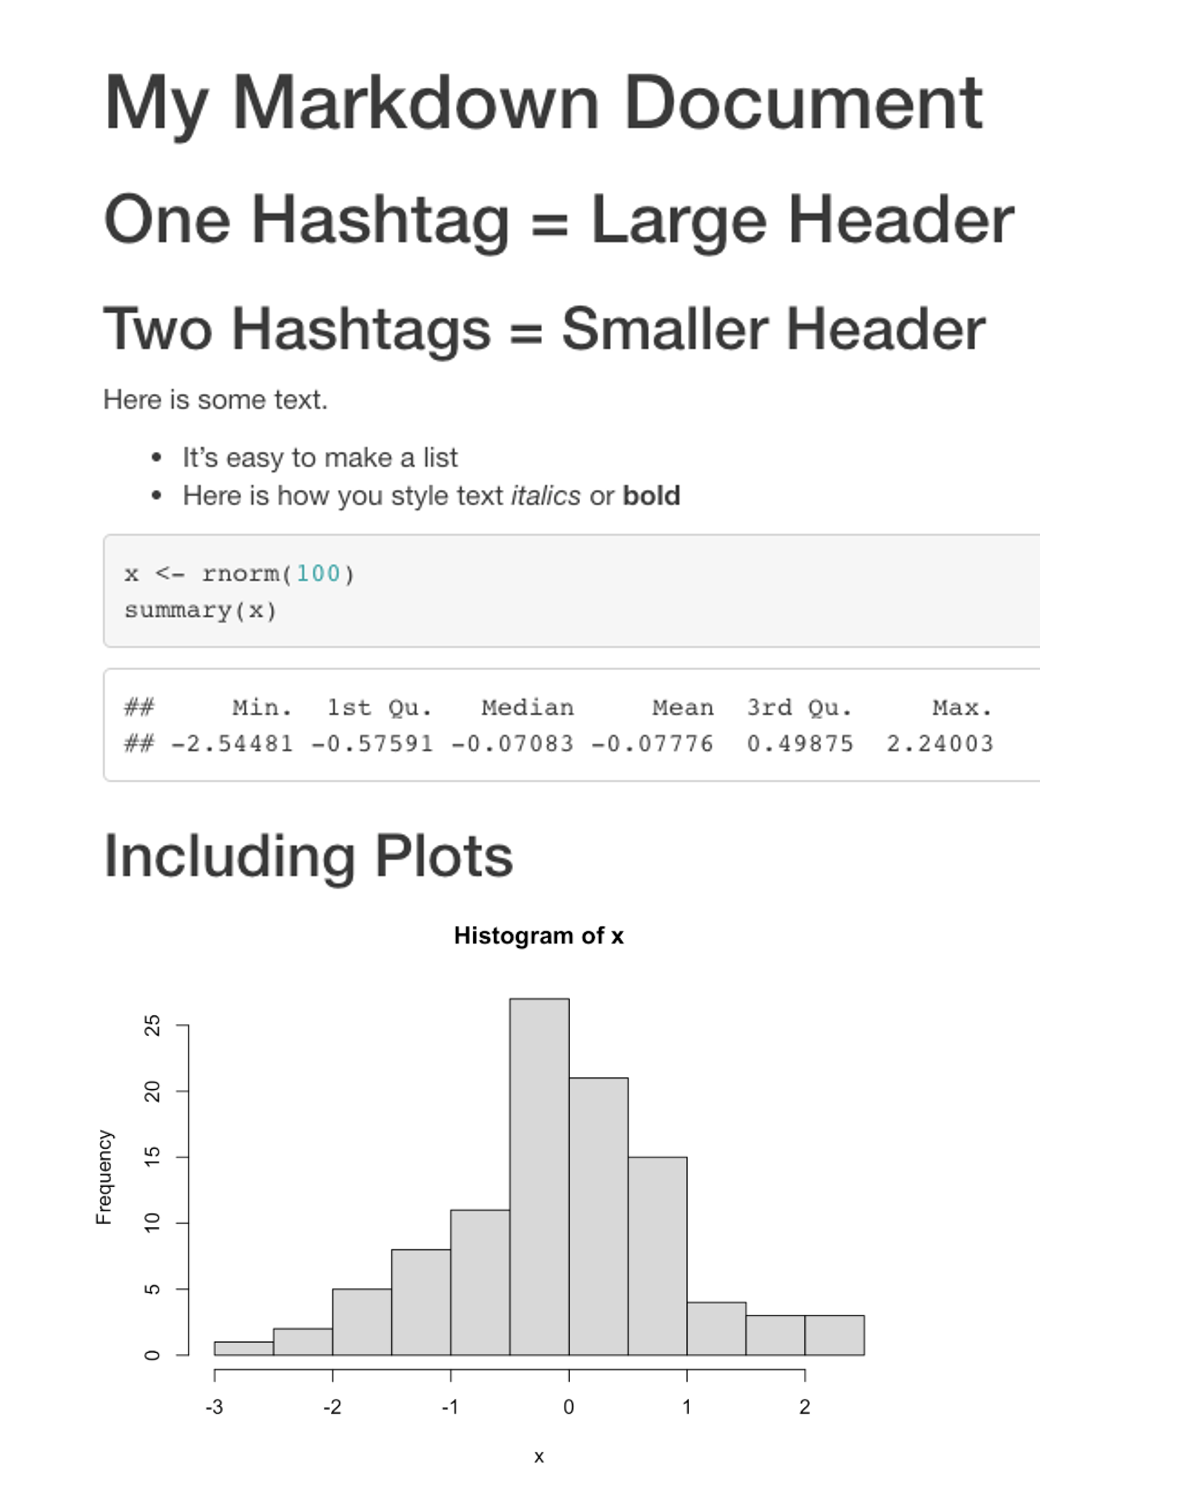
Rendering (“Knitting”)
Your Turn #2
Go to File > New File > R Markdown. Click OK.
This will give you a handy template which is used to show you a working example of a simple R Markdown document. You will be asked to provide a title and author, and you can choose any values you like, such as “Test” or “My First Markdown”.
Run each chunk by clicking the green “play” button ( ). Note what happens.
Knit the document with the “ball of yarn” button ( ). Type “test” and click Save to save the HTML file. Inspect the HTML document.
03:00
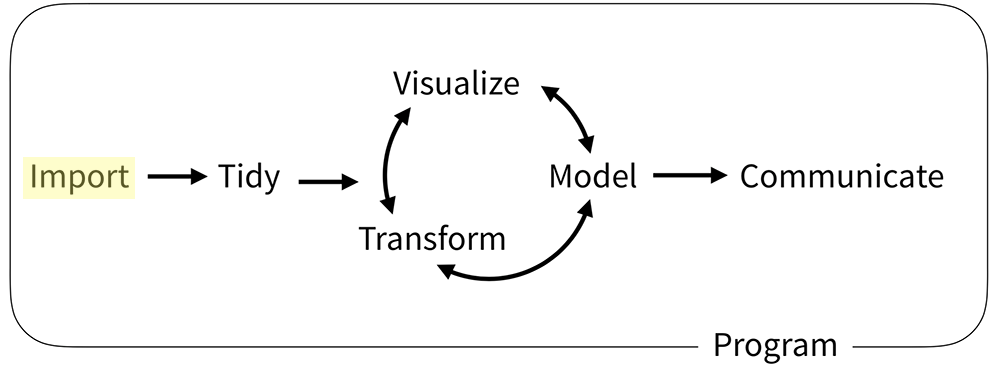
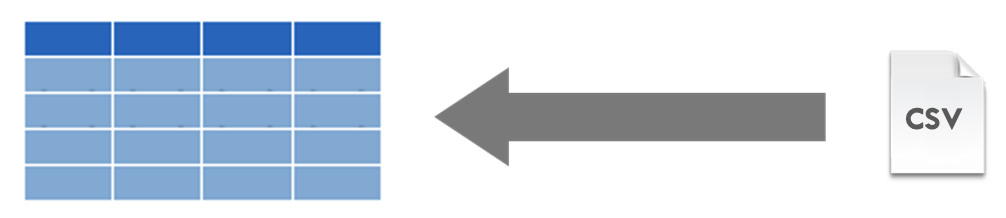
The Data Analysis Pipeline
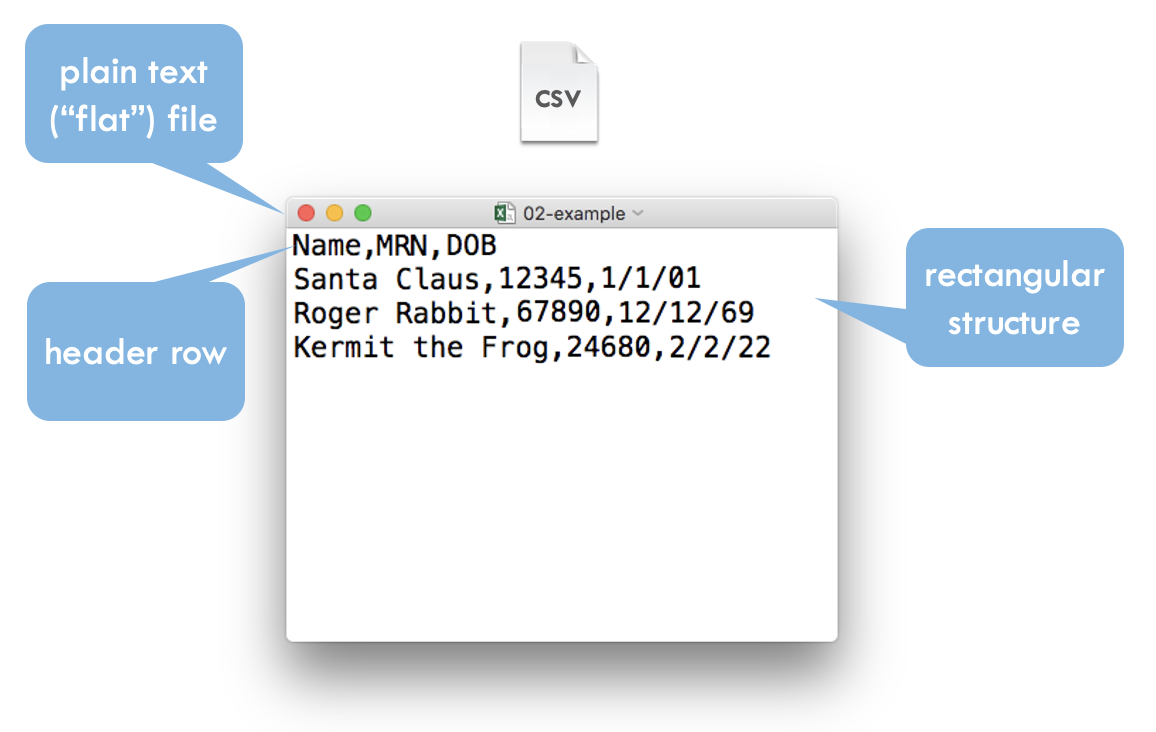
CSV
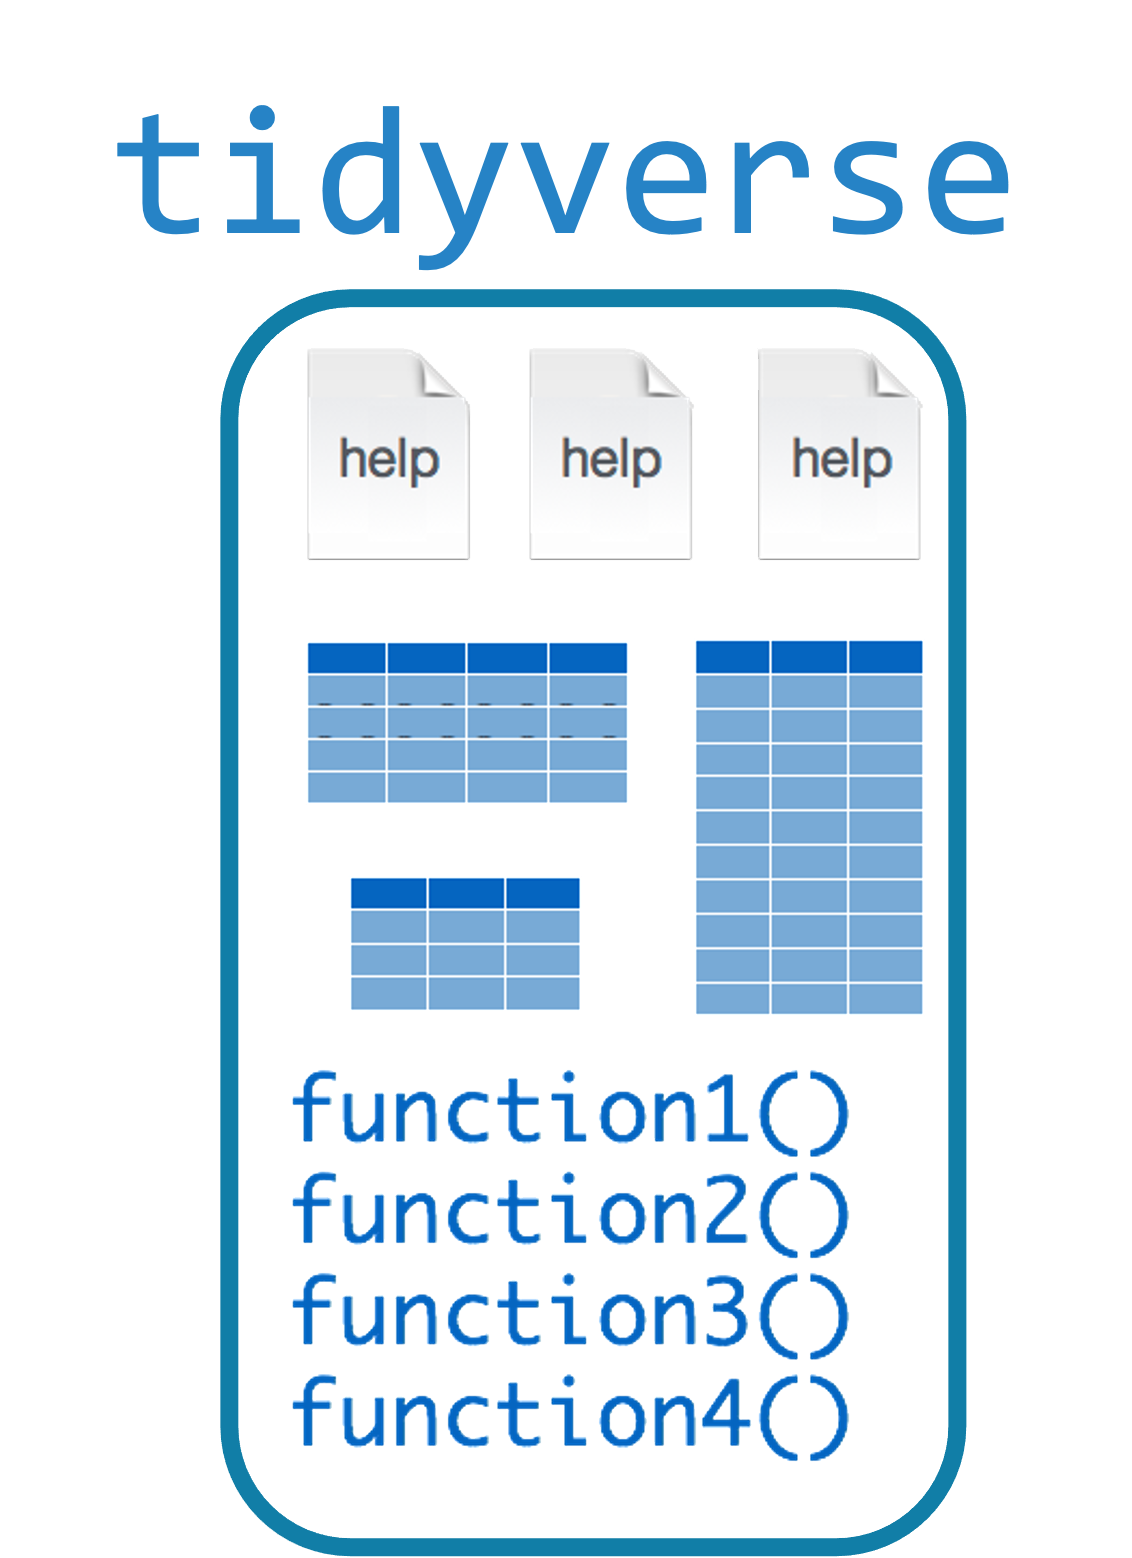
Tidyverse
- A consistent way to organize data
- Human readable, concise, consistent code
- Build pipelines from atomic data analysis steps
![]()
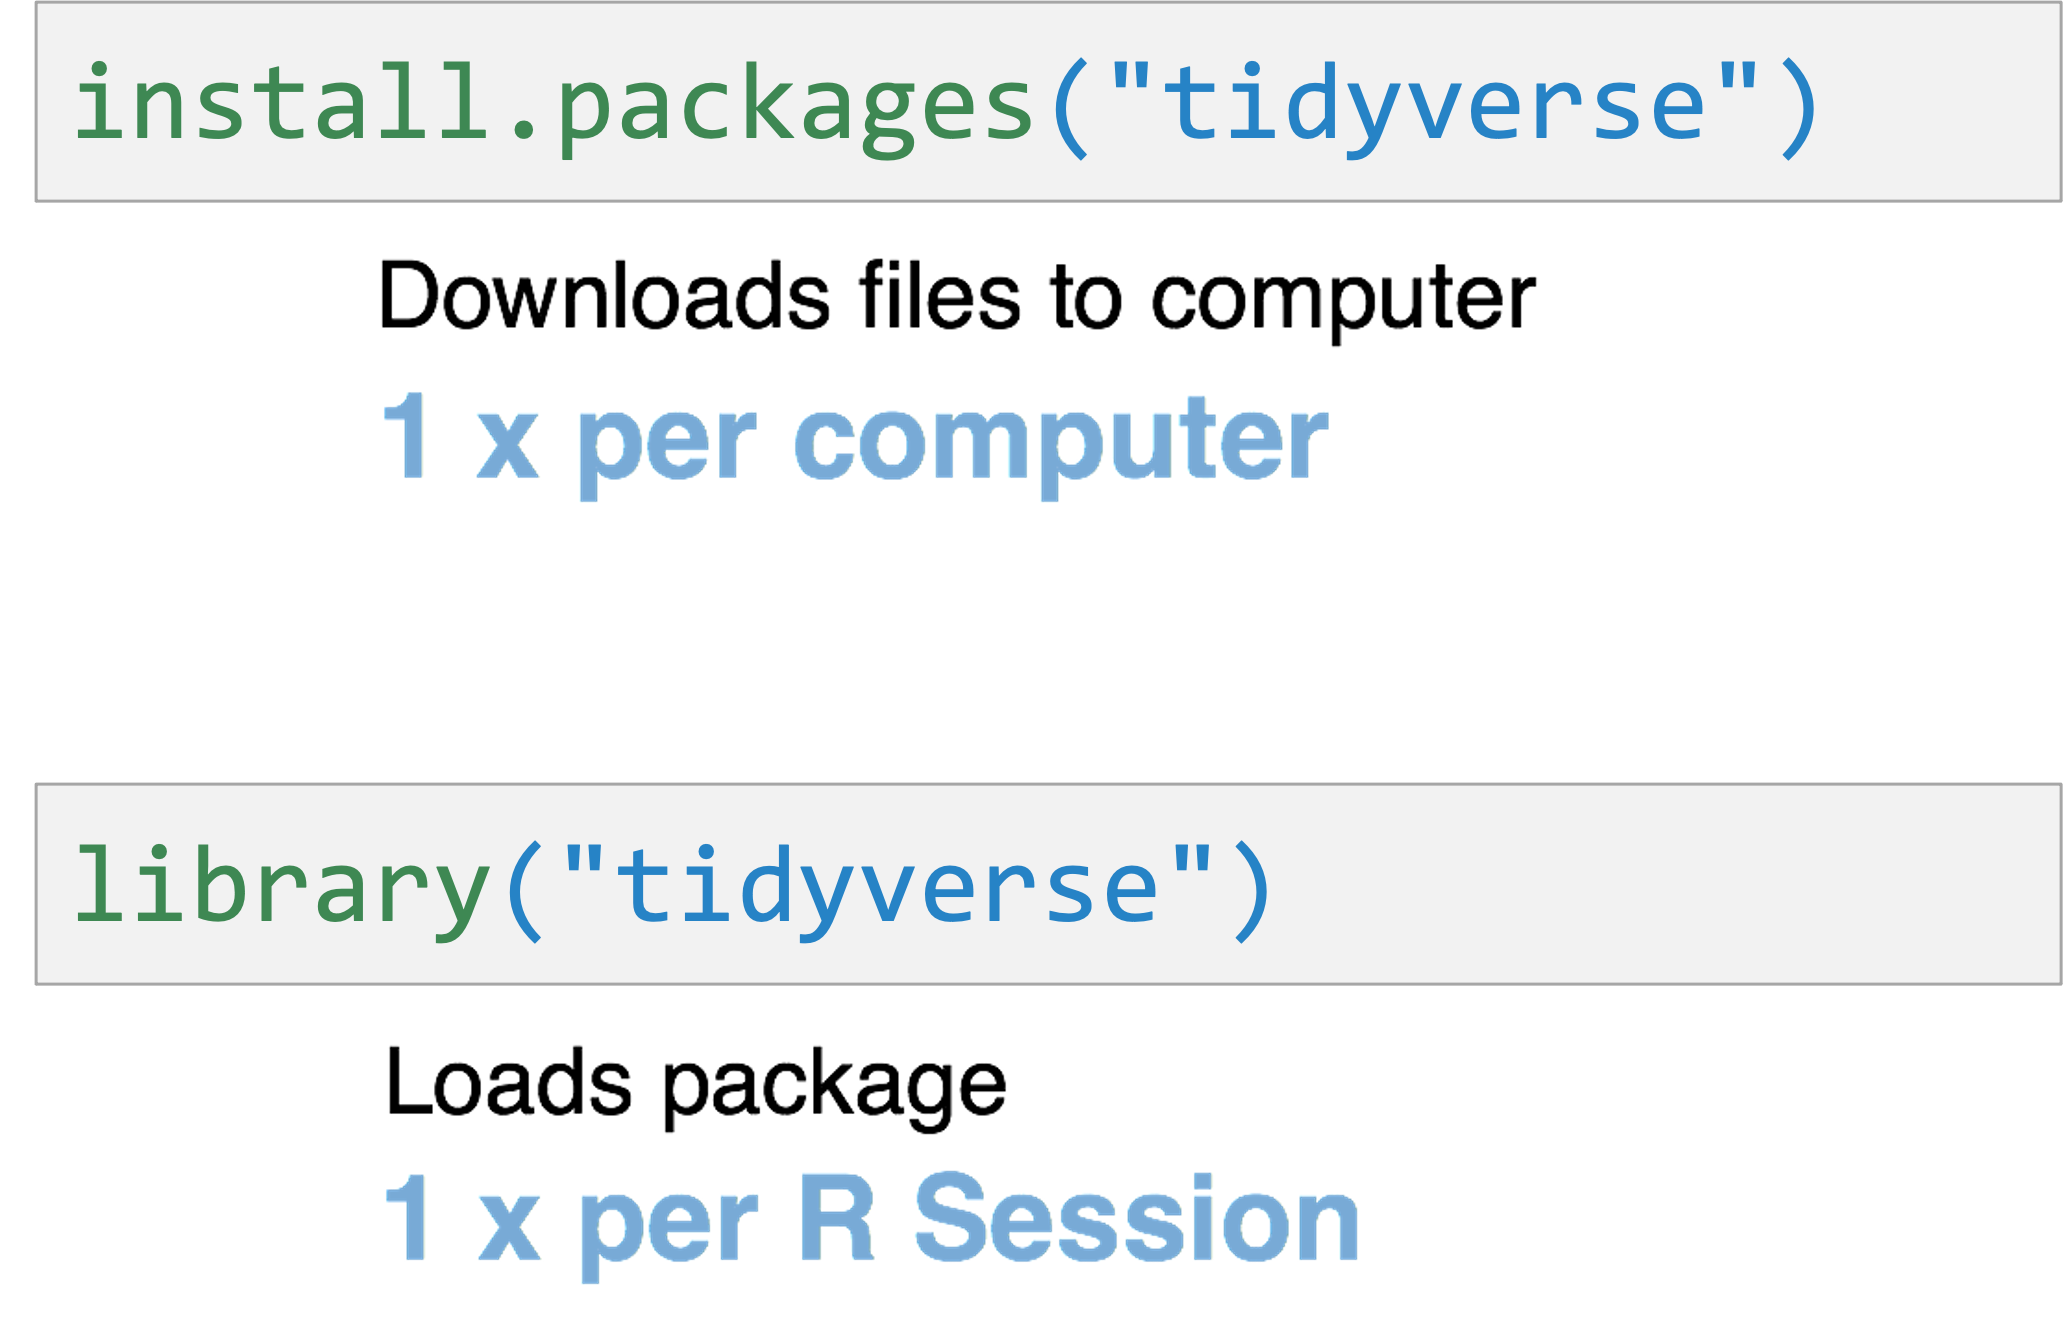
Installing and Loading Packages
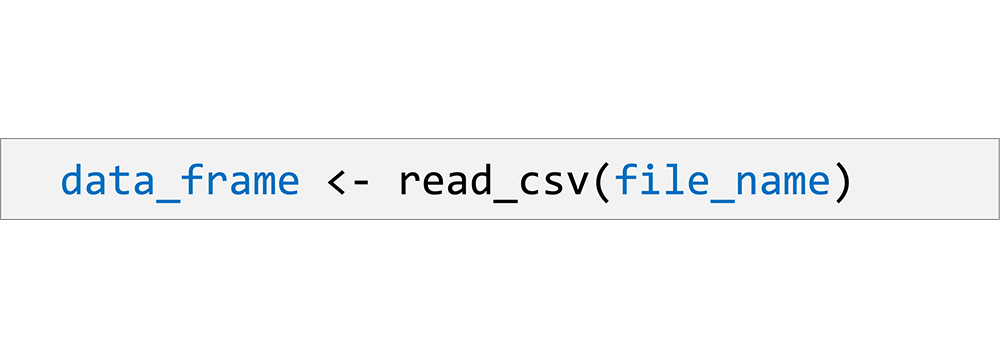
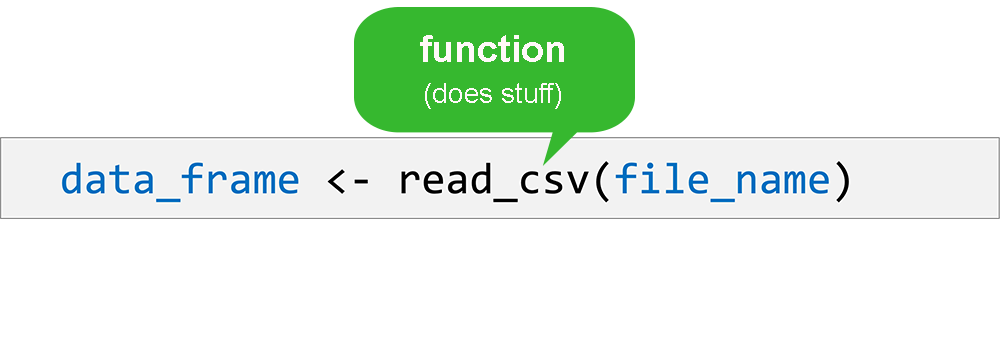
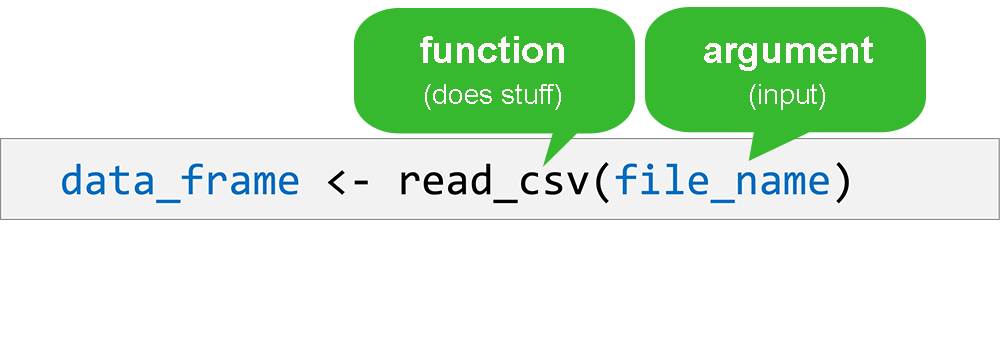
read_csv()
Functions
Functions
Functions
Functions
read_csv()
Your Turn #3
In the Files pane, click on the folder exercises.
Open the R Markdown file titled 01 – Introduction.Rmd. Instructions for this exercise are in the text of the R Markdown document.
Click ( ) when you are done.
05:00
Recap
![]()
Programming Language
![]()
IDE (Editor)
![]()
Document Format
Packages extend the functionality of R. Install with install.packages() and load with library()
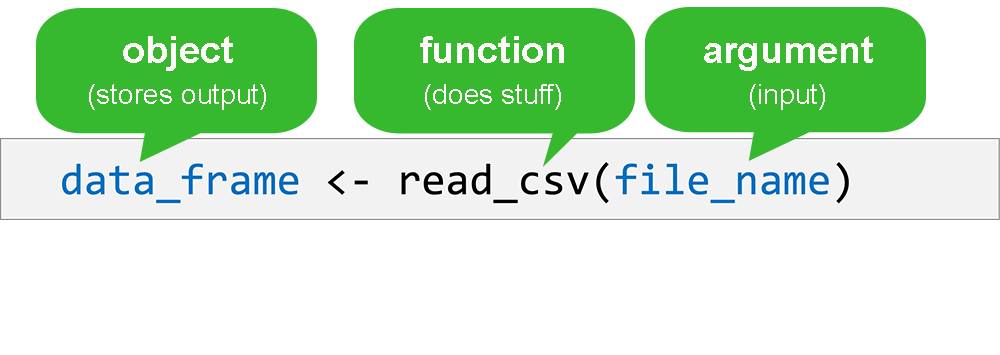
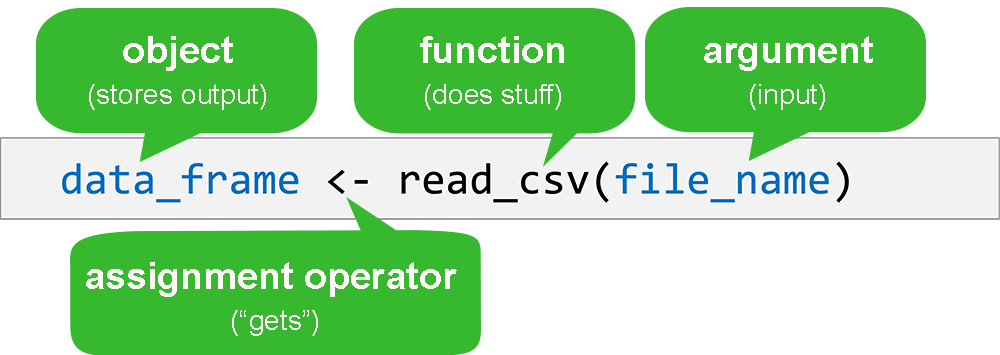
Functions do stuff. They accept Arguments as input and return an Output. Capture an output in an Object using the assignment operator ( <- ).
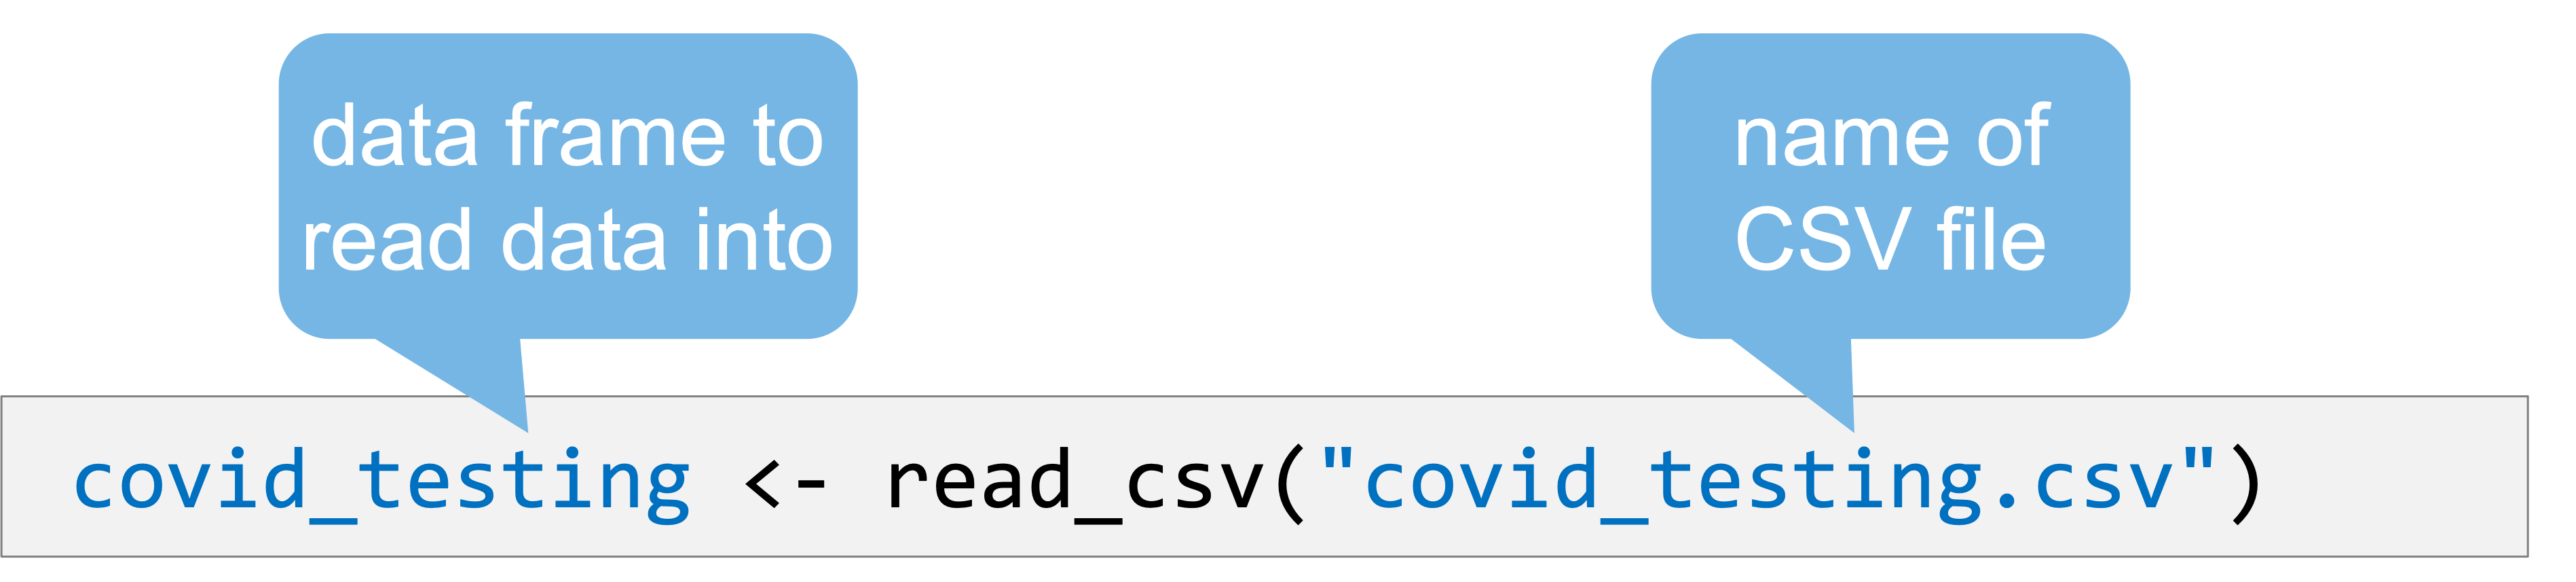
Importing Data is the first step of data analysis. Use read_csv() from the tidyverse package to import data stored in a CSV file.
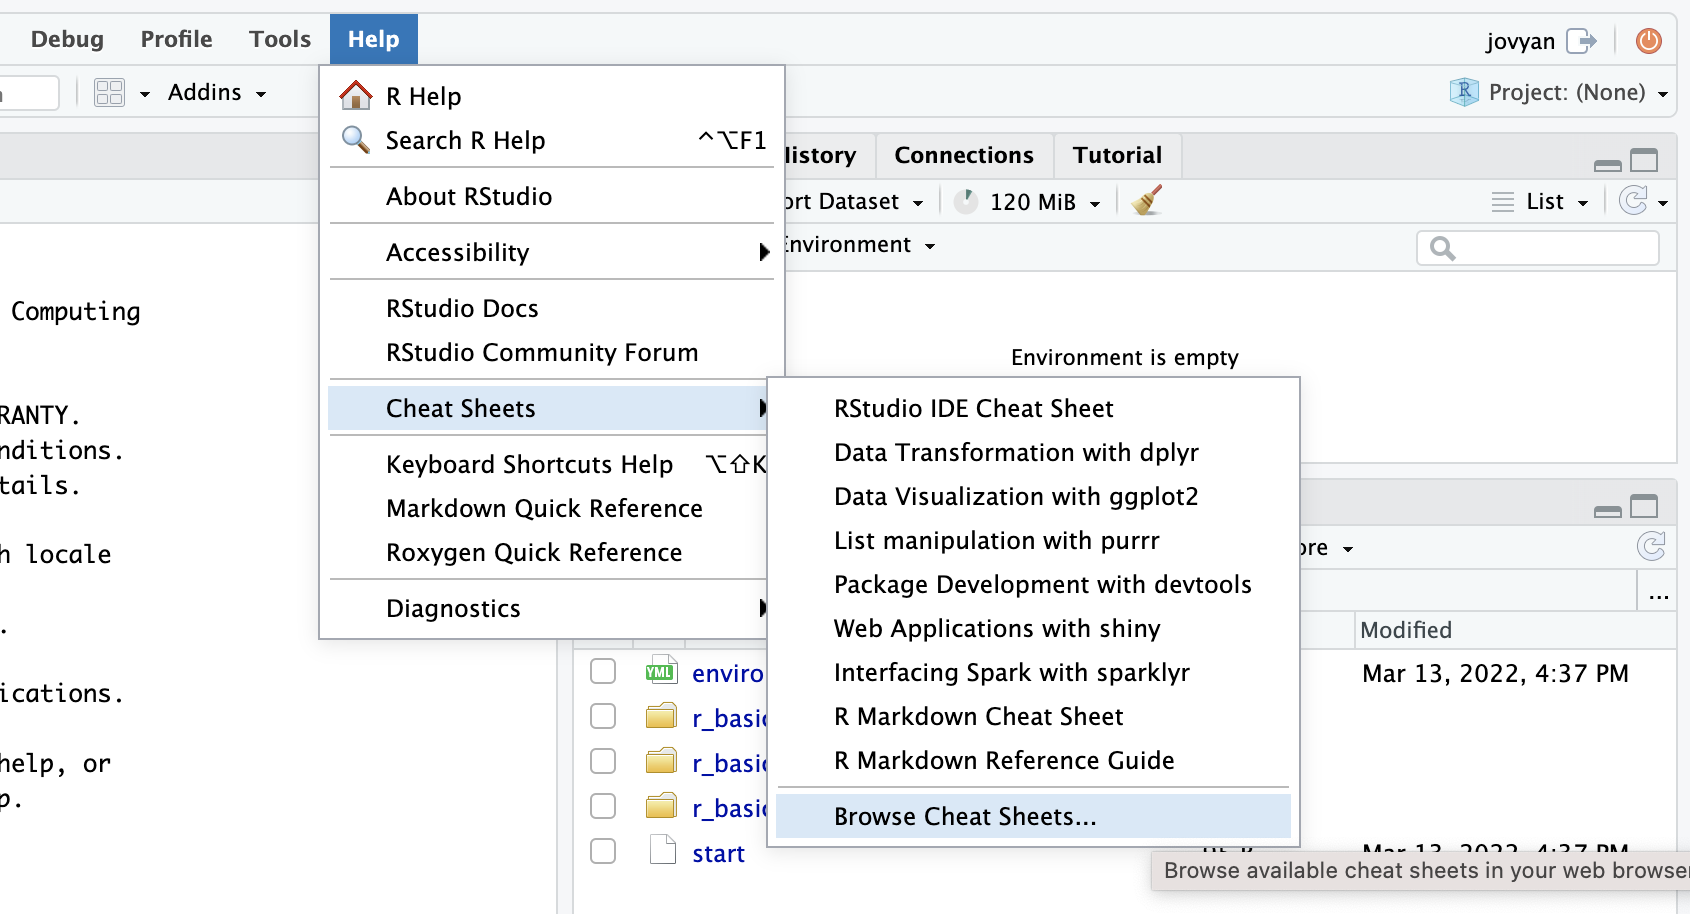
Cheat Sheets
R for Data Science
In English: https://r4ds.had.co.nz/
English unofficial solutions at https://jrnold.github.io/r4ds-exercise-solutions/index.html
In Spanish: https://es.r4ds.hadley.nz/
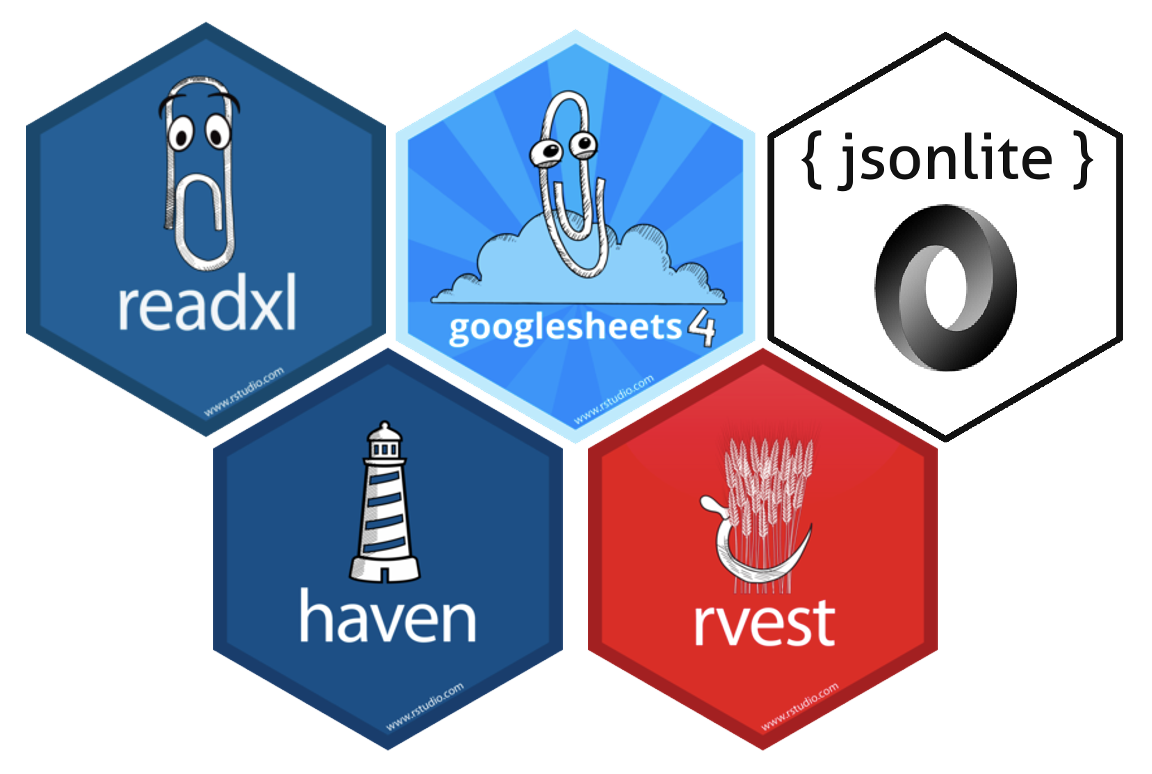
File Formats
Databases

Other Output Formats
R Interface to Python

```{python}
import pandas
covid_testing.info()
```
![]()